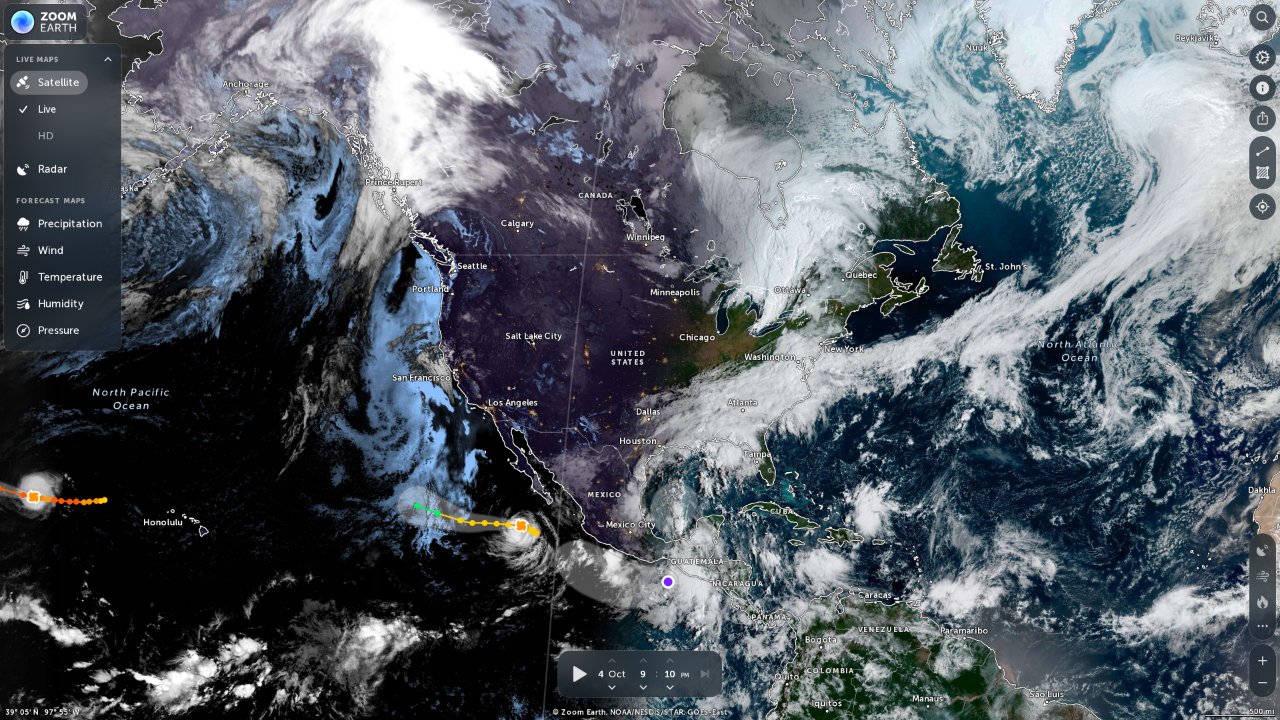
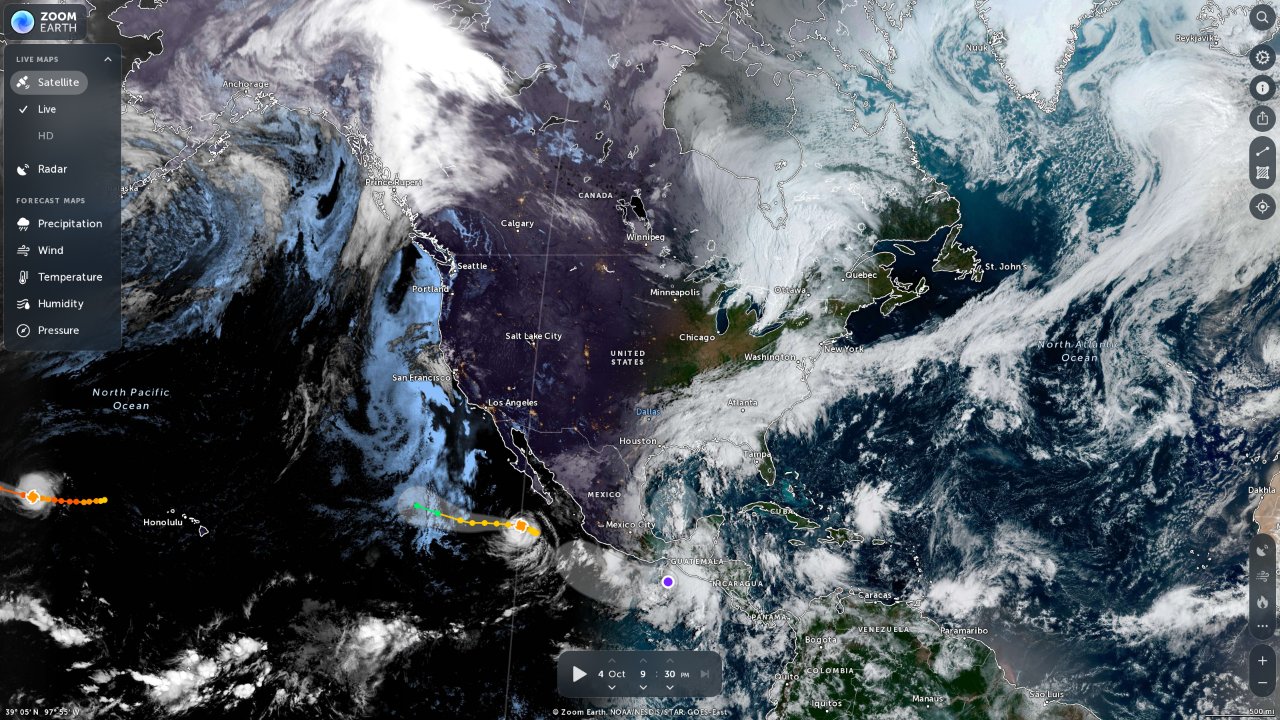
Zoom Earth (zoom.earth) is an interactive weather map: open the page and you're looking at near-real-time satellite imagery of the whole planet, with optional radar, wind, rain and temperature forecast layers, plus hurricane tracks and wildfire hotspots. It takes professional data otherwise scattered across national weather agencies' websites and turns it into one smooth map that anyone — no account, no training — can use (official About page, checked 2026-10-04).
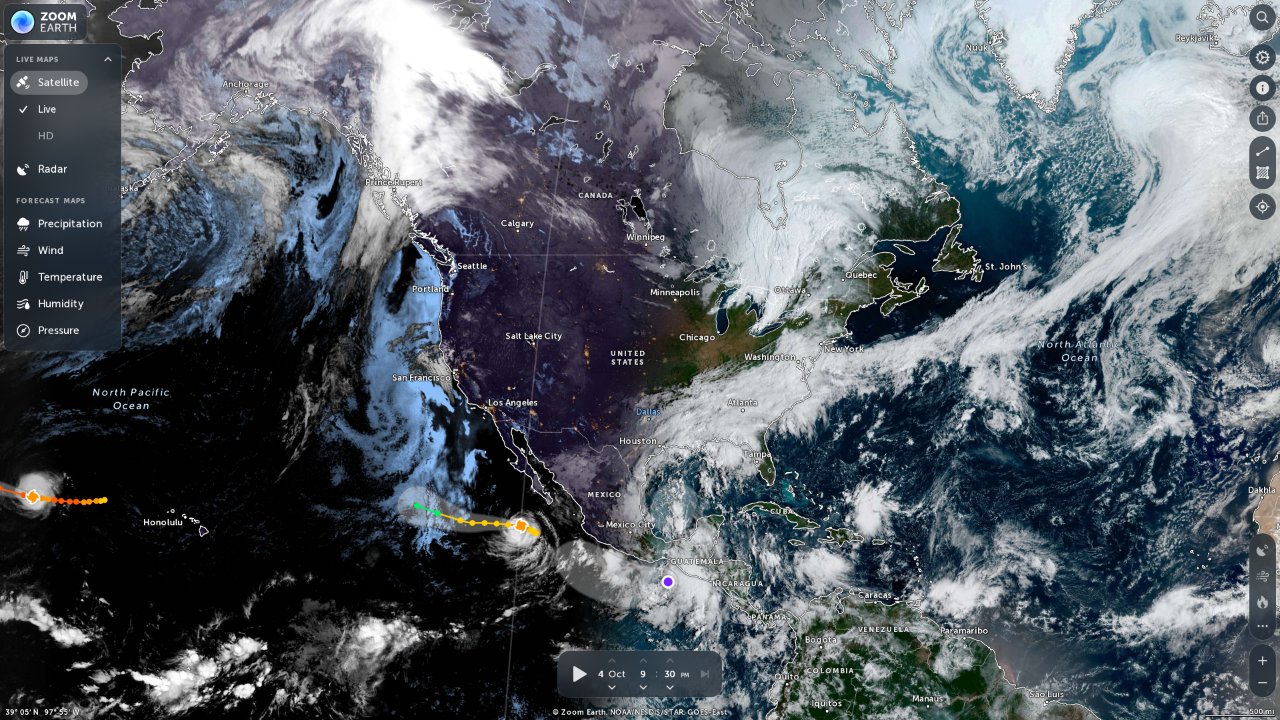
The main interface (screenshot from 2026-10-04): a global satellite view with cloud imagery that pans, zooms and animates.
Quick facts
| Item | Details |
|---|---|
| URL | https://zoom.earth/ |
| Type | Interactive weather map / hurricane tracker |
| Pricing | Free (web carries sponsorships/ads); iOS and Android apps available |
| Account | None required |
| Interface | English |
Background
Zoom Earth is made by Neave Interactive, the studio of British developer Paul Neave — the same team behind Webcam Toy and other web toys; the zoom.earth domain was registered in June 2016 (Neave Interactive, Terms of Service, checked 2026-10-04). It is not a commercial weather company: its role is to turn publicly available data from official agencies into a map interface ordinary people can understand.
Core capabilities
- Near-real-time satellite imagery: geostationary feeds from NOAA GOES, EUMETSAT Meteosat and JMA Himawari, with animations covering several hours; an HD layer updates twice daily from NASA's Aqua/Terra polar-orbiting satellites (via GIBS).
- Forecast layers: wind, rain, temperature and pressure forecast maps based on two global models — DWD ICON and NOAA GFS.
- Radar: processed in real time from multiple meteorological sources.
- Hurricane/typhoon tracking: track data from NHC, JTWC, NRL and the IBTrACS archive, with intensity and forecast paths.
- Wildfires and heat spots: fire incidents from NIFC, CIFFC, Copernicus CEMS/EFFIS and GDACS; satellite heat spots (NASA FIRMS) update once daily — not live.
- Map labels: geographic labels from OpenStreetMap.
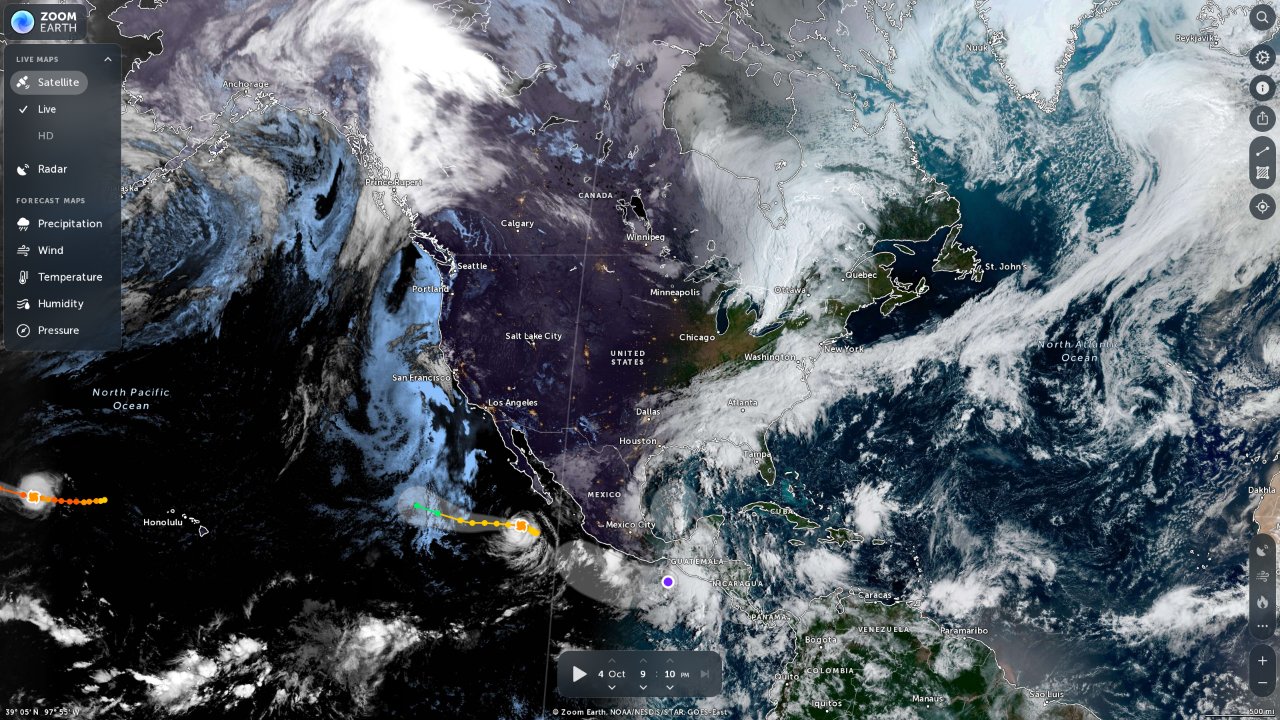
The interface (2026-10-04): the layer panel on the left (live/HD satellite, radar, precipitation, wind, temperature and more), a timeline at the bottom — and, off the Mexican coast, the track line of an active tropical cyclone.
Good for
- Typhoon season tracking: far more intuitive than text forecasts for coastal residents and travelers.
- "Reading the sky" before a trip: check cloud systems and rain radar over your destination.
- Teaching: a hands-on way to demonstrate weather systems, satellites and radar in geography or science classes.
- Following large-scale events like wildfires and smoke plumes.
Limitations
- It's data visualization, not a forecasting service: no street-level hourly forecasts and no alert push (the apps have some notifications).
- The HD satellite layer updates only twice a day — "near real time" refers to geostationary imagery; fire detections update daily and shouldn't be read as live fire intelligence.
- English-only interface; the mobile web version offers slightly less than the apps.
- Ad-supported, so expect ad slots on the page.
Alternatives
- Windy: the same genre of interactive weather map, with more layers and models aimed at outdoor-sports and aviation users; Zoom Earth is lighter and more immediate for satellite imagery.
- earth.nullschool.net: an artistic take on global weather maps, famous for its animated wind streamlines.