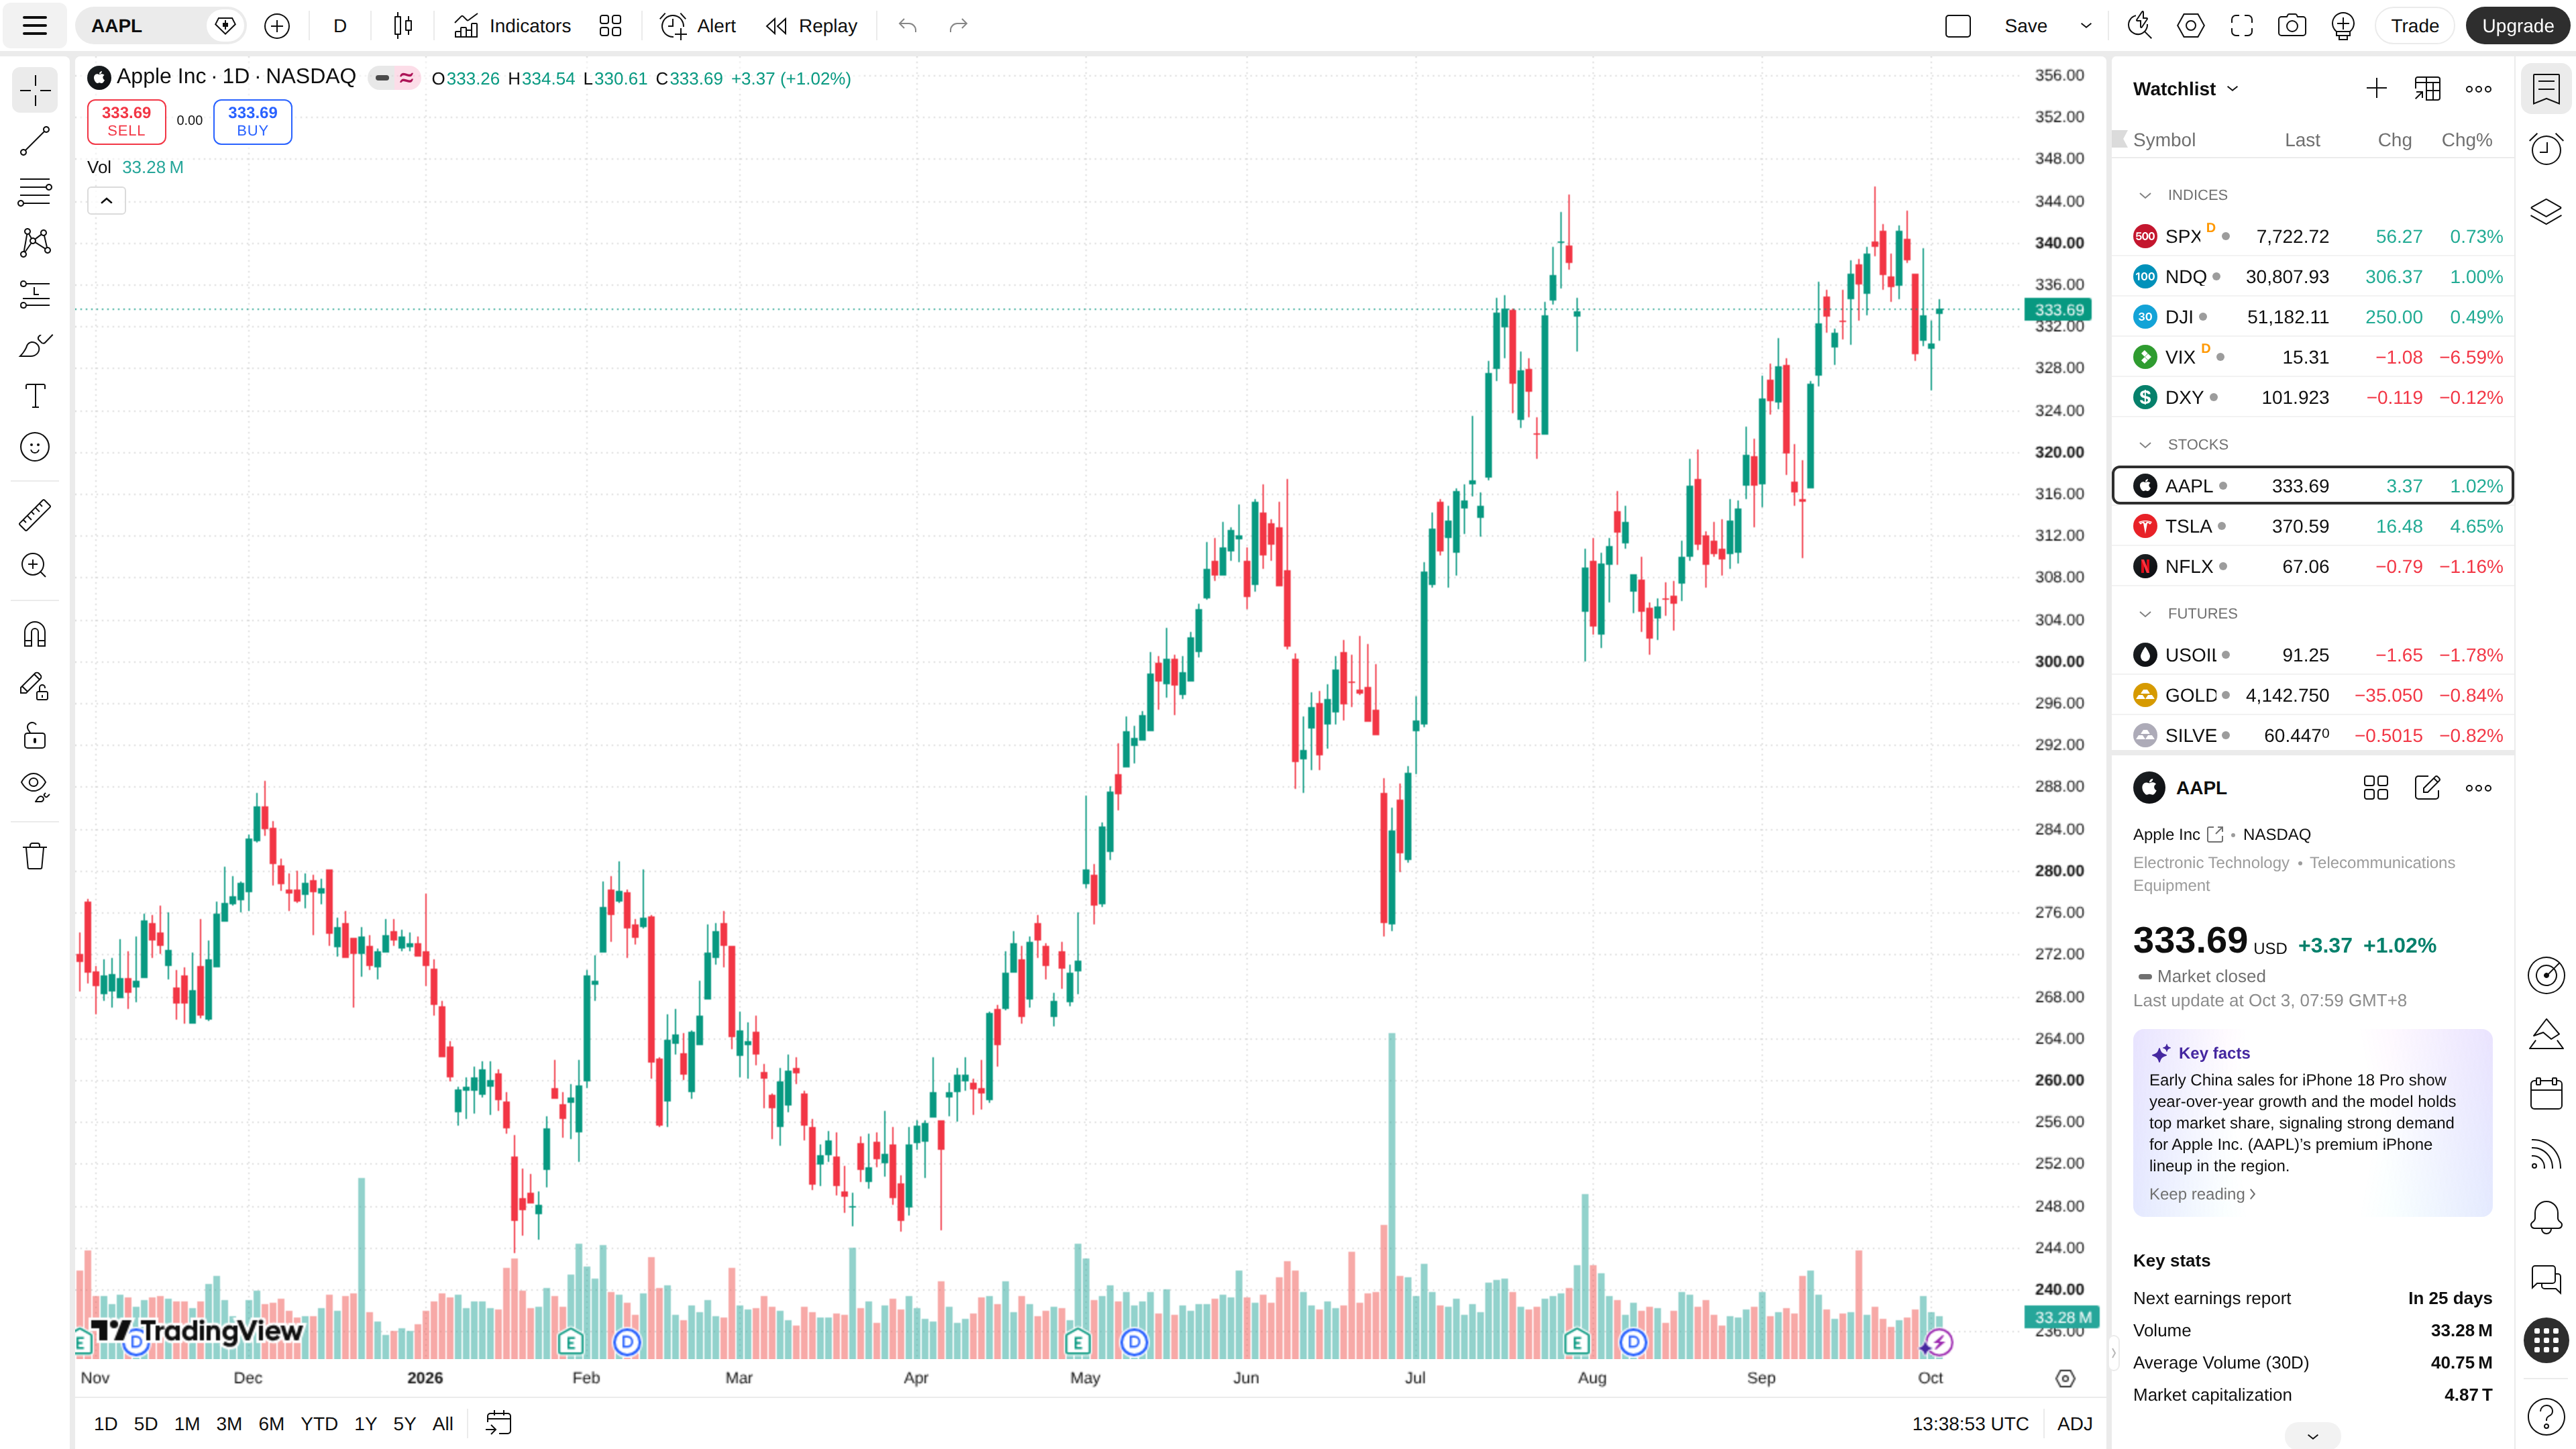
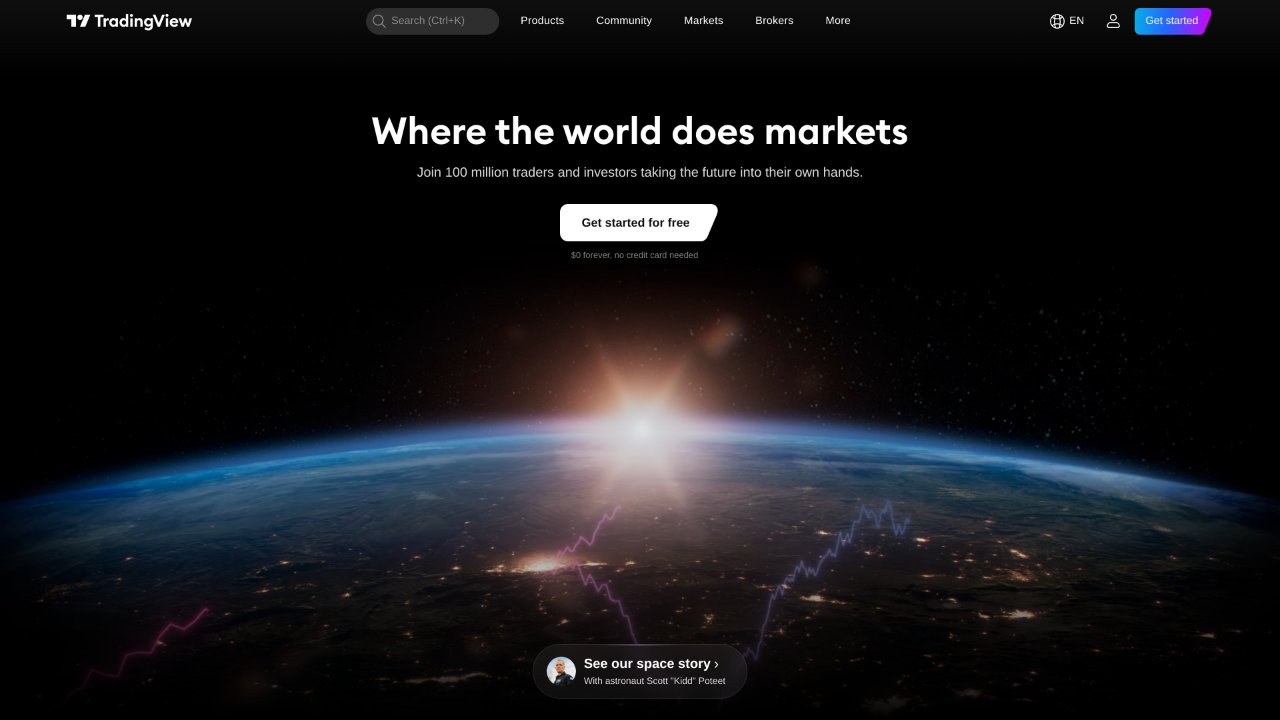
TradingView (tradingview.com) brings professional market charts into the browser: real-time and delayed quotes for stocks, crypto, forex and futures, hundreds of technical indicators and drawing tools, and a built-in community where people publish market ideas. The company describes itself as a "charting platform and social network" used by more than 100 million traders and investors worldwide (official About page, checked 2026-10-04).
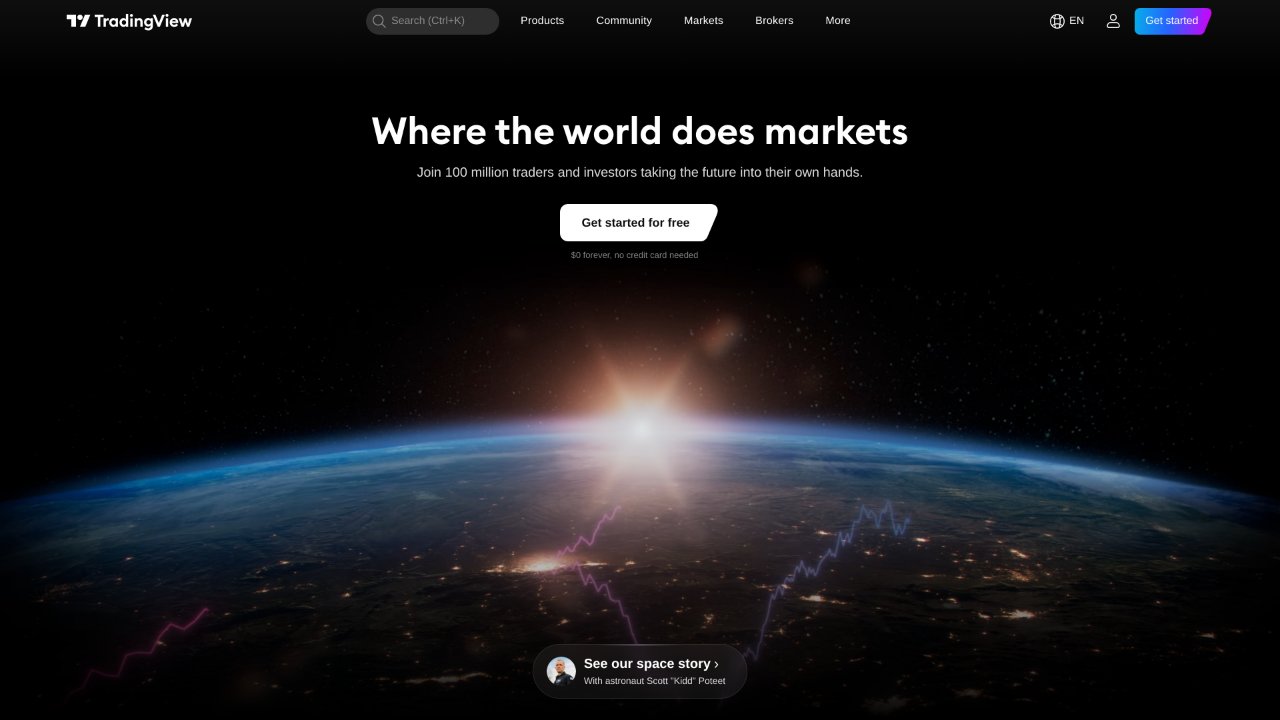
The homepage (screenshot from 2026-10-04).
Quick facts
| Item | Details |
|---|---|
| URL | https://www.tradingview.com/ |
| Type | Charting platform + investor community |
| Pricing | Basic free (single chart, with ads); Essential 29.95/mo; Premium 239.95/mo (as of 2026-04, pricing, StockBrokers.com 2026 review); real-time data for some exchanges sold separately |
| Account | Quotes need no account; saving charts and publishing indicators or ideas requires registration |
| Interface | Multiple languages including Simplified and Traditional Chinese |
Background
TradingView was founded in September 2011 by Constantin Ivanov, Denis Globa and Stan Bokov. Headquartered in New York, it also runs offices in London, Málaga, Tbilisi and elsewhere (Wikipedia, checked 2026-10-04). Its early edge was "professional charts in the browser" — capability that previously belonged to Bloomberg terminals or desktop software — before layering on the community, screeners, broker integrations and its own scripting language.
Core capabilities
- Professional charts: candlesticks, Renko, Point & Figure and more, with hundreds of built-in indicators and drawing tools; paid tiers add charts per tab (Essential 2, Premium 8, Ultimate 16) and more indicators per chart.
- Pine Script: a proprietary language for custom indicators and backtested strategies, with a huge library of community-published open scripts.
- Screeners: filter stocks, crypto and forex pairs by financial and technical criteria.
- Alerts: price, indicator and drawing alerts, with quotas by tier (single digits on Basic, thousands on Premium).
- Community and streams: publish ideas, strategy scripts and live video; idea pages embed the chart being discussed.
- Market coverage: major global exchanges; the free tier is delayed for some markets, and real-time data is sold per exchange.
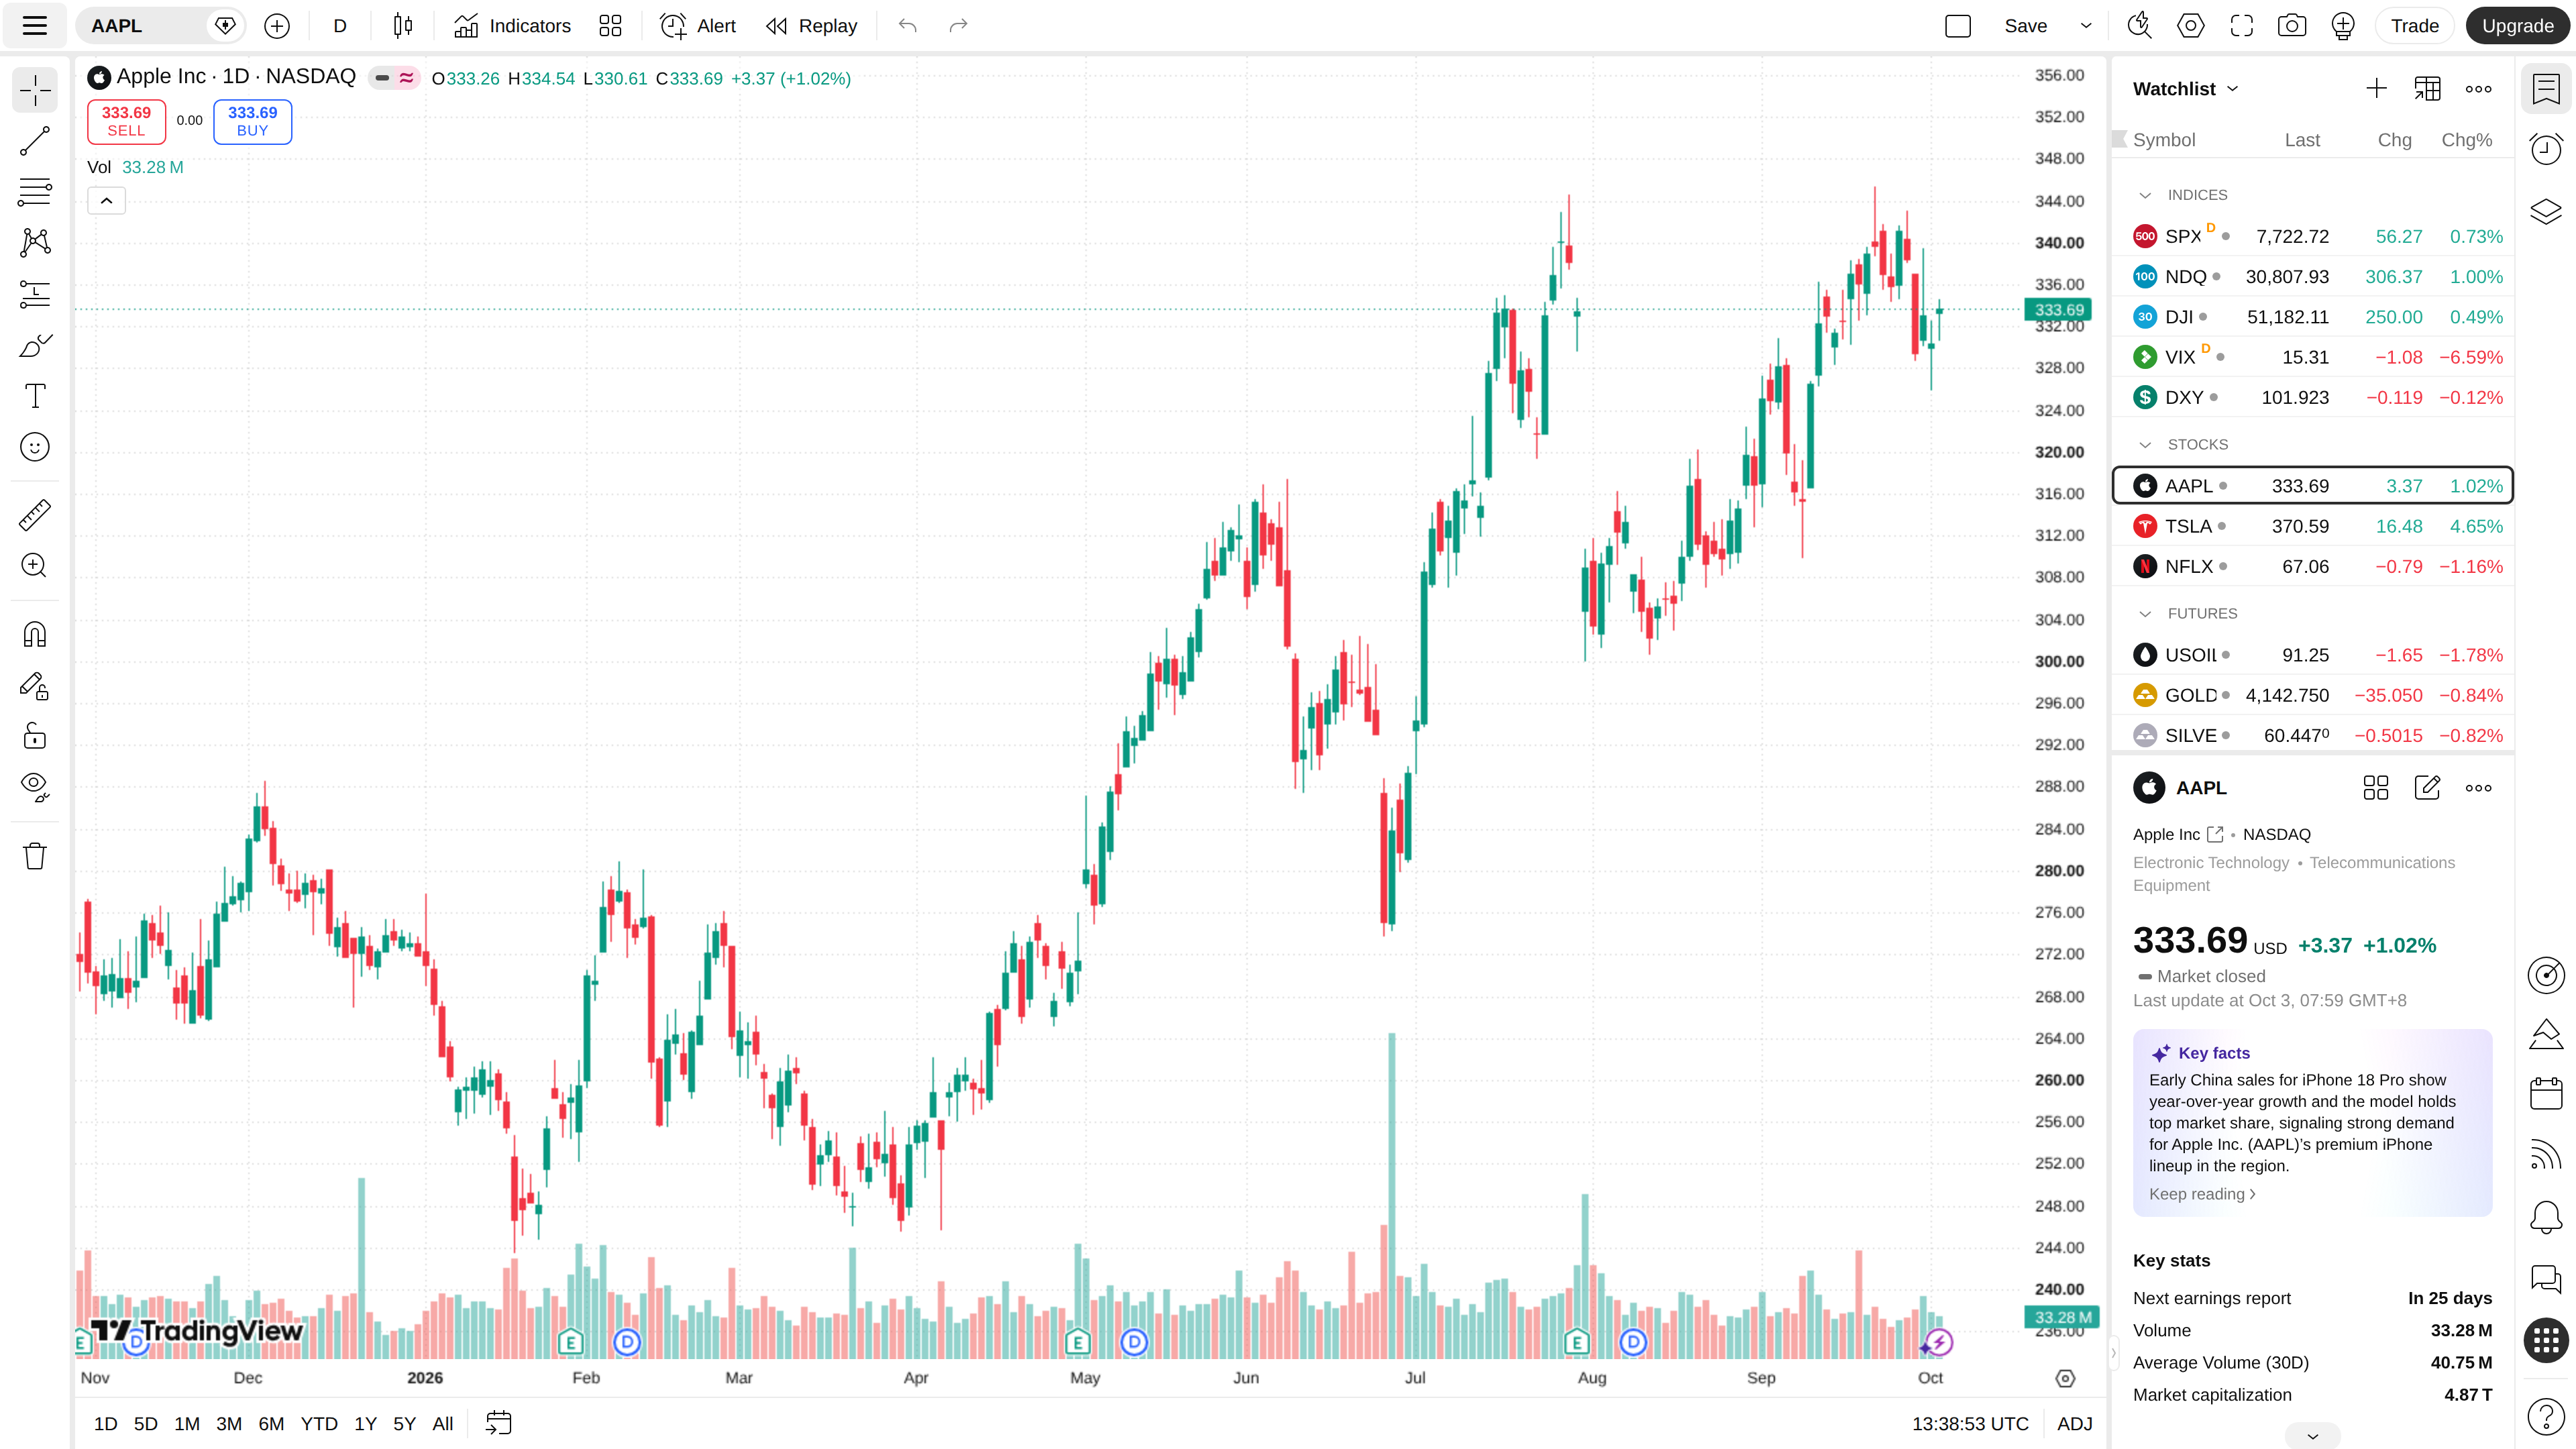
A chart page (2026-10-04): the technical-analysis interface on a popular instrument.
Content policy
Ideas and scripts are user content; publishing requires accepting the House Rules, which prohibit things like paid-signal promotion and account-management advertising, with takedown and ban mechanisms behind them. The embedded charting components (Charting Library) are commercially licensed to third parties.
Good for
- Individual investors: watchlists, drawing and alerts in one browser tab.
- Technical-analysis and quant hobbyists: prototype ideas in Pine Script or borrow community scripts.
- Content creators: publish chart-backed market commentary to a built-in audience.
Limitations
- The free tier is visibly constrained: one chart, three indicators per chart, ads — serious multi-screen watching means paying.
- Real-time data for some exchanges (especially US equities and futures) costs extra and stacks on the subscription.
- Community content is uneven — nothing published there is investment advice, and Pine backtests invite overfitting.
- Premium capabilities (second-based intervals, Bar Replay, deeper history) sit behind the most expensive tiers.
Alternatives
- Koyfin: a modern research platform leaning fundamentals and macro data.
- Broker tools / 同花顺 / 东方财富: Chinese-language quote and news ecosystems better suited to A-share investors.
- MetaTrader: the forex industry's standard desktop software — execution over community.