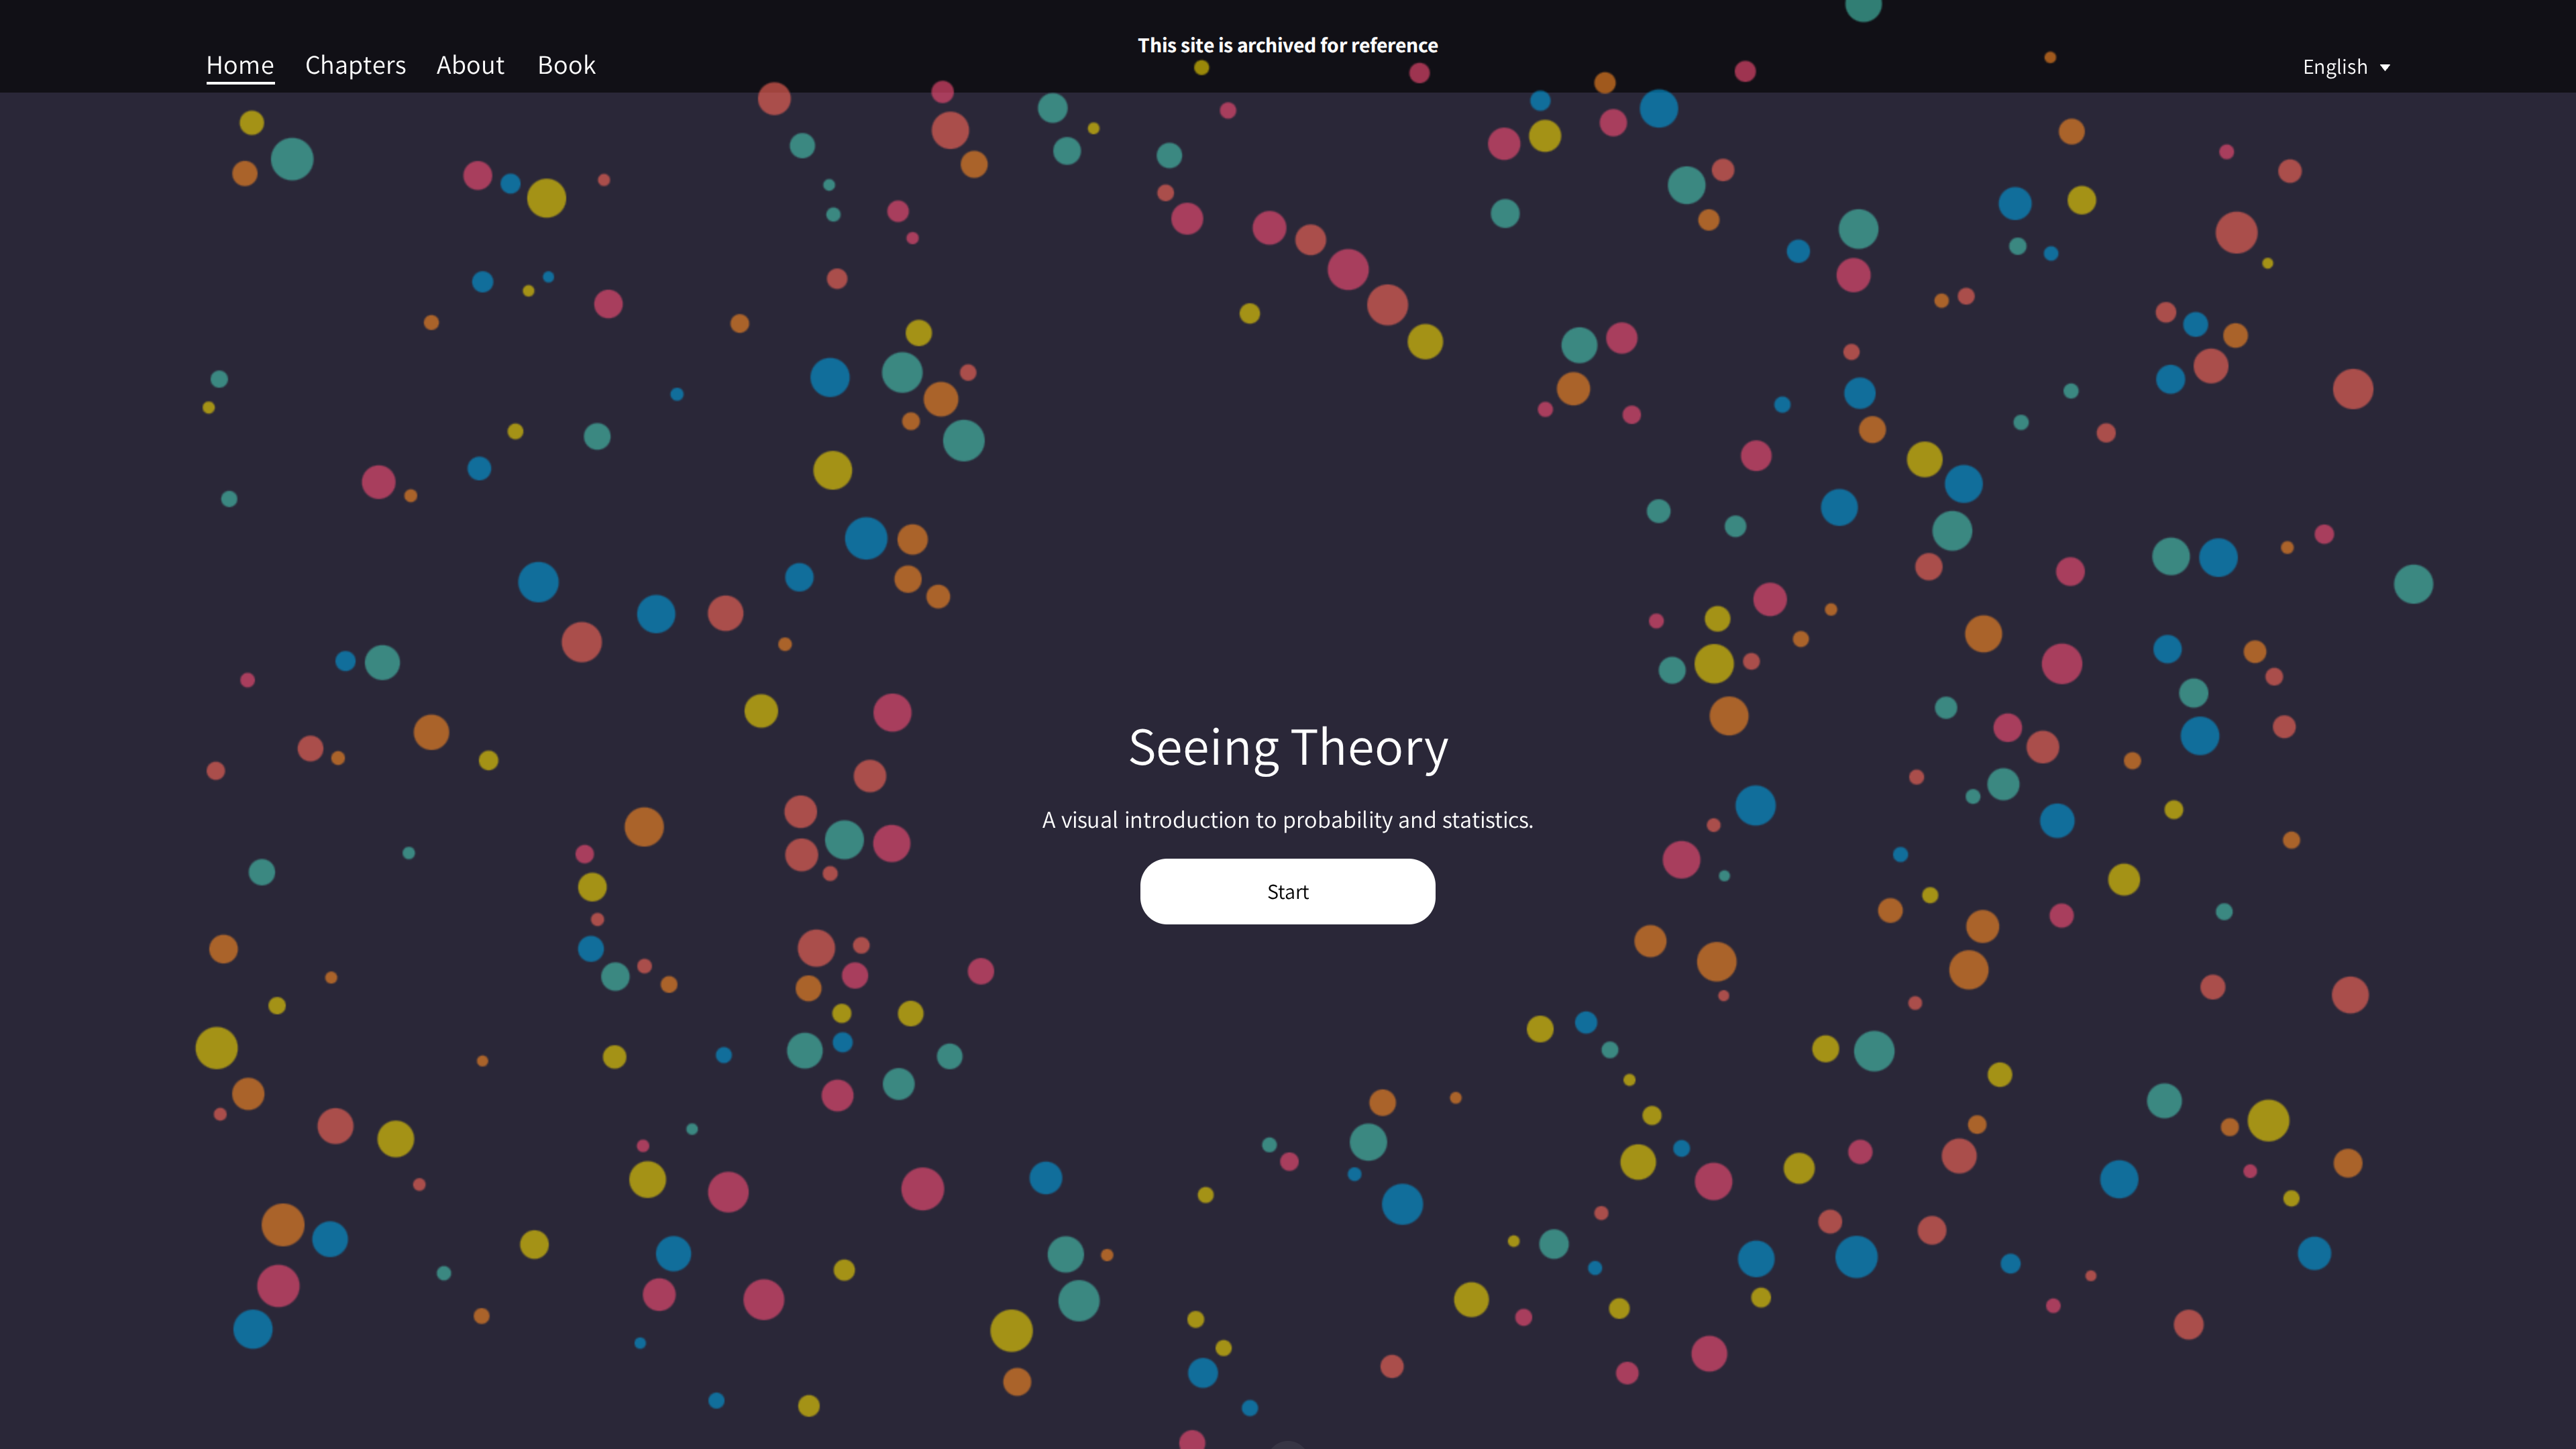
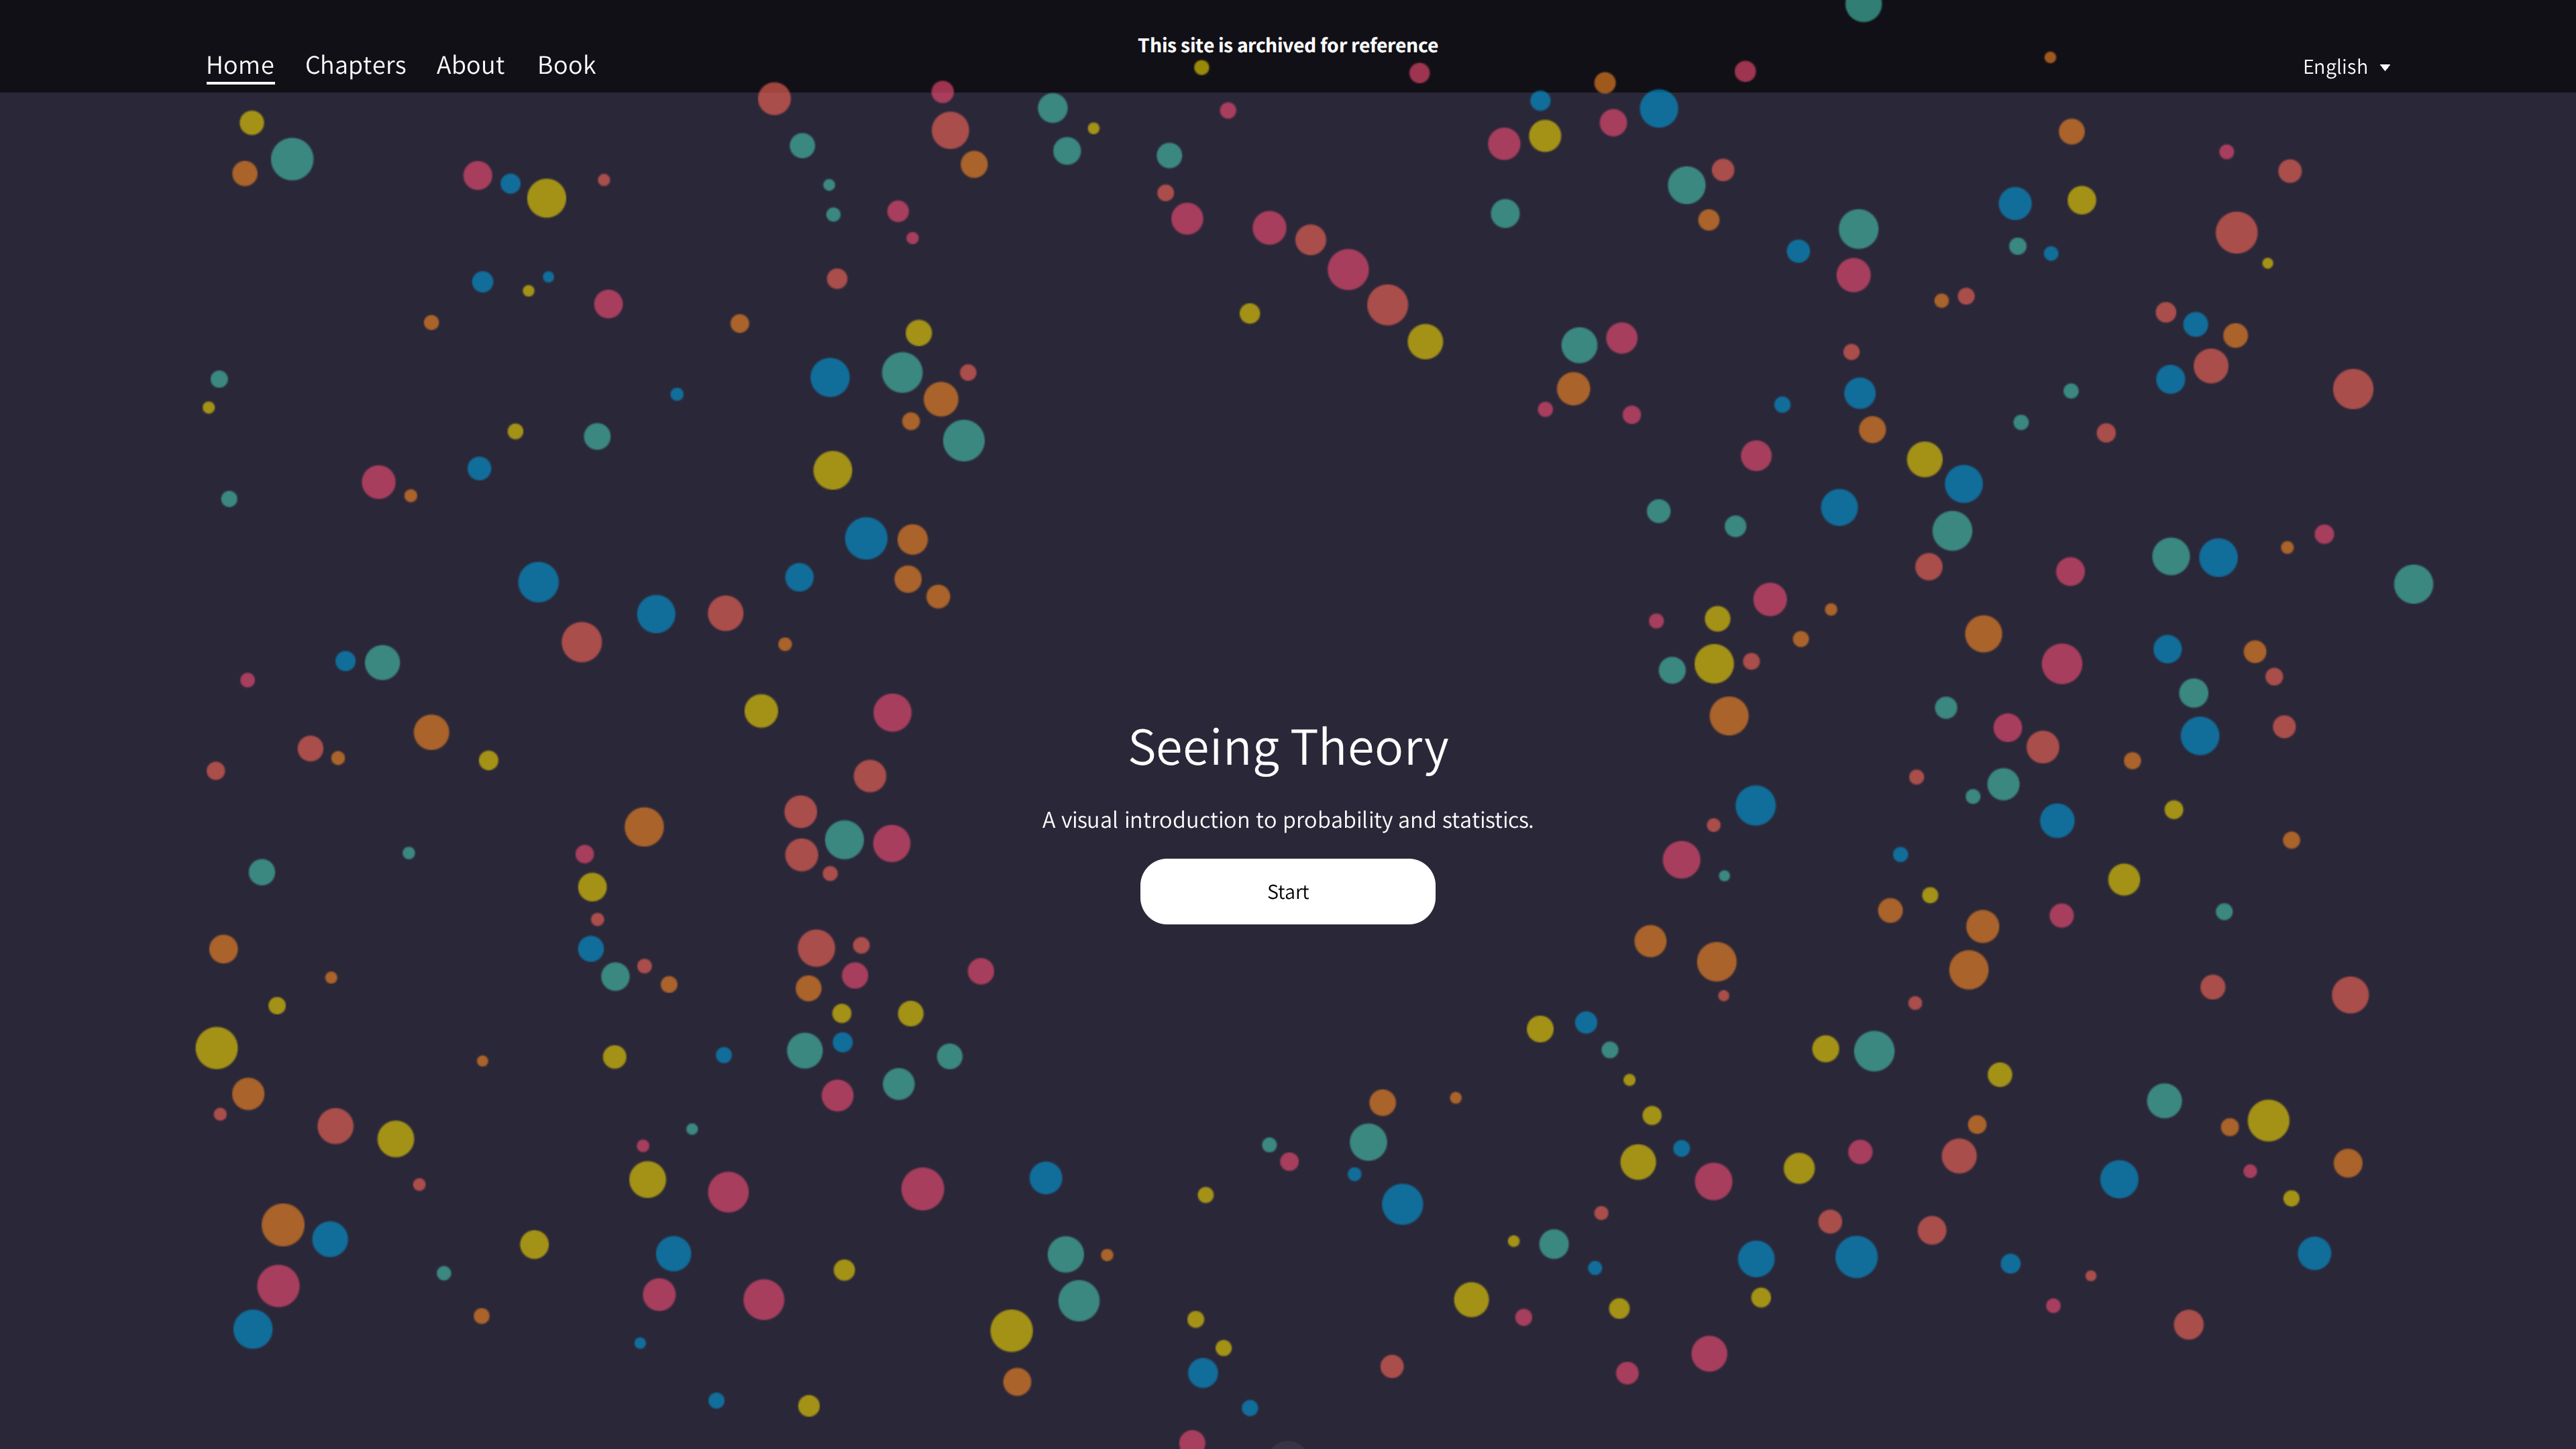
Seeing Theory is an online "visual textbook" for probability and statistics: colorful interactive animations built with D3.js turn the most abstract concepts of probability theory and statistics into graphics you can manipulate directly. It was started by Brown University undergraduate Daniel Kunin together with Jingru Guo (Rhode Island School of Design), Tyler Dae Devlin and Daniel Xiang, and won the 2018 Webby Award in the Education category.
At a Glance
| Item | Details (as of 2026-09-30) |
|---|---|
| URL | seeing-theory.brown.edu |
| Type | Interactive online textbook (probability and statistics) |
| Cost | Free |
| Account | None required |
| Languages | English, Chinese (Simplified) and Spanish |
| License | Source code under Apache-2.0 |
Background
The project began in a web applications course at Brown: Kunin and Guo teamed up for the final project, then Devlin and Xiang joined to turn coursework into a public product (documented in a February 2018 Brown Daily Herald story). The stated goal is to make statistics more accessible through interactive visualizations, technically built on Mike Bostock's D3.js. The team is also writing a companion textbook, available as a downloadable PDF draft.
Note that the site currently carries a banner reading "This site is archived for reference" — the content remains fully accessible, but the project is no longer actively maintained.
Chapters
Six chapters, each with about three interactive sections:
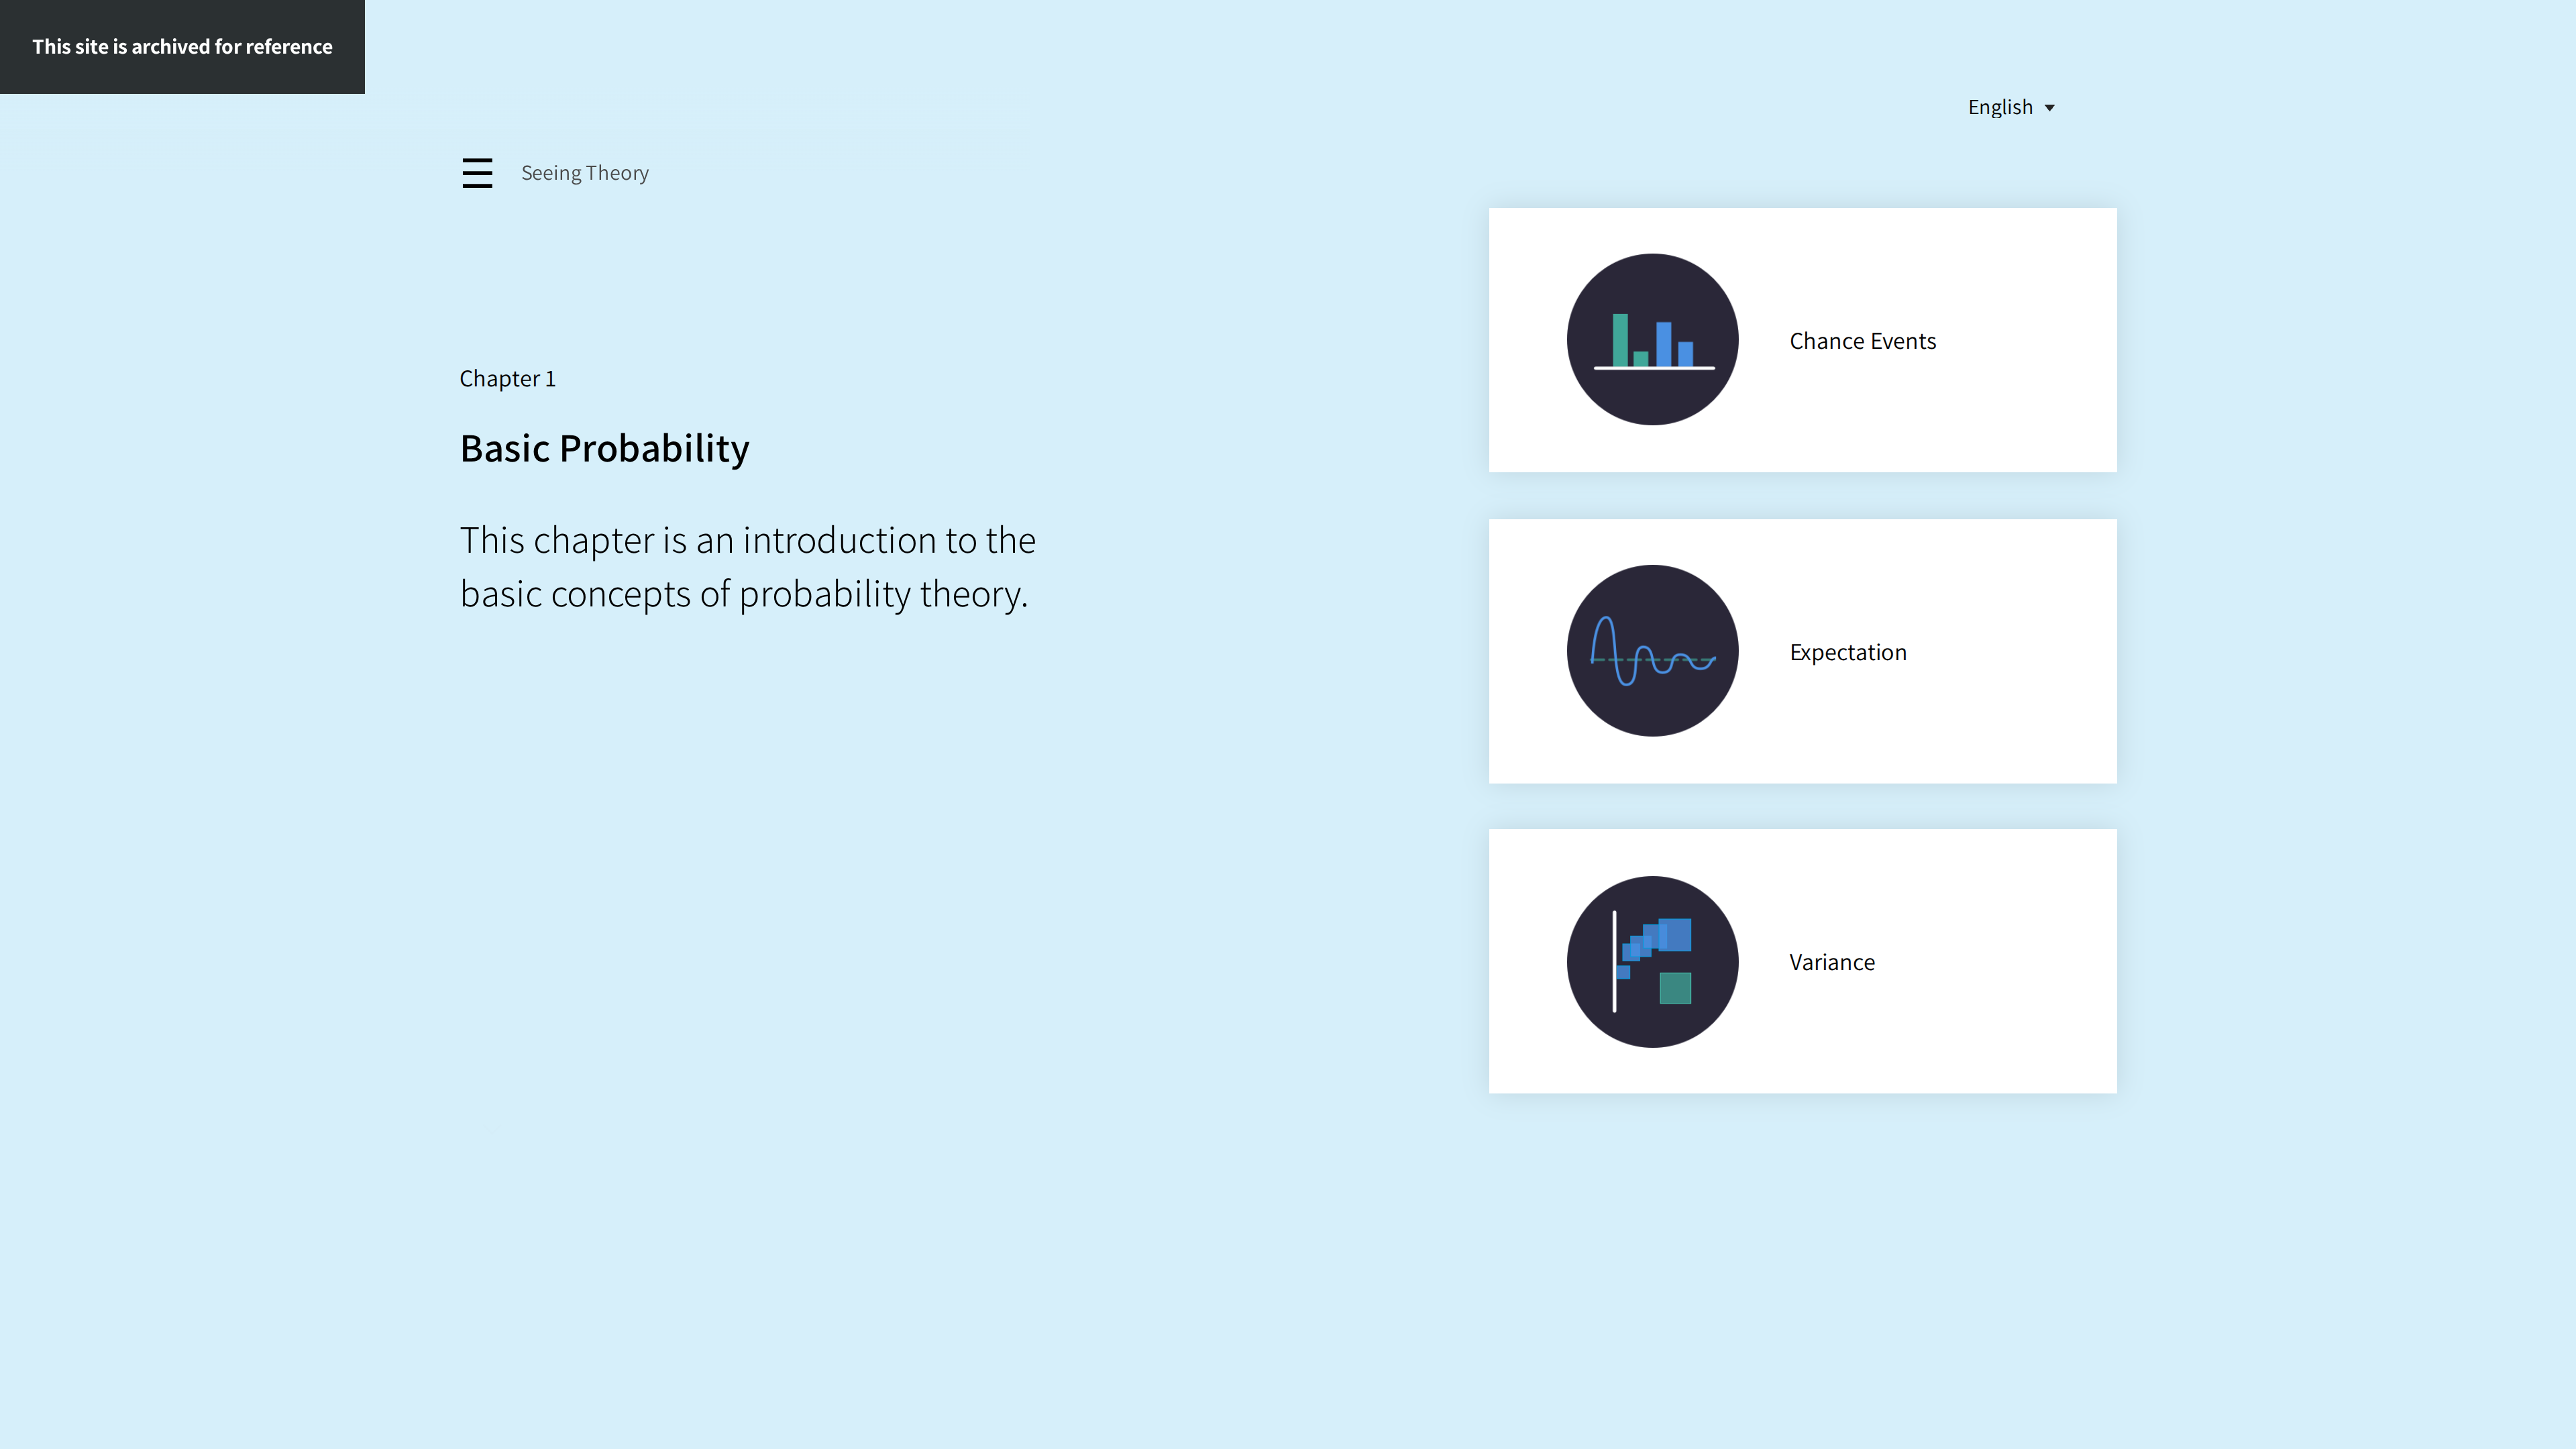
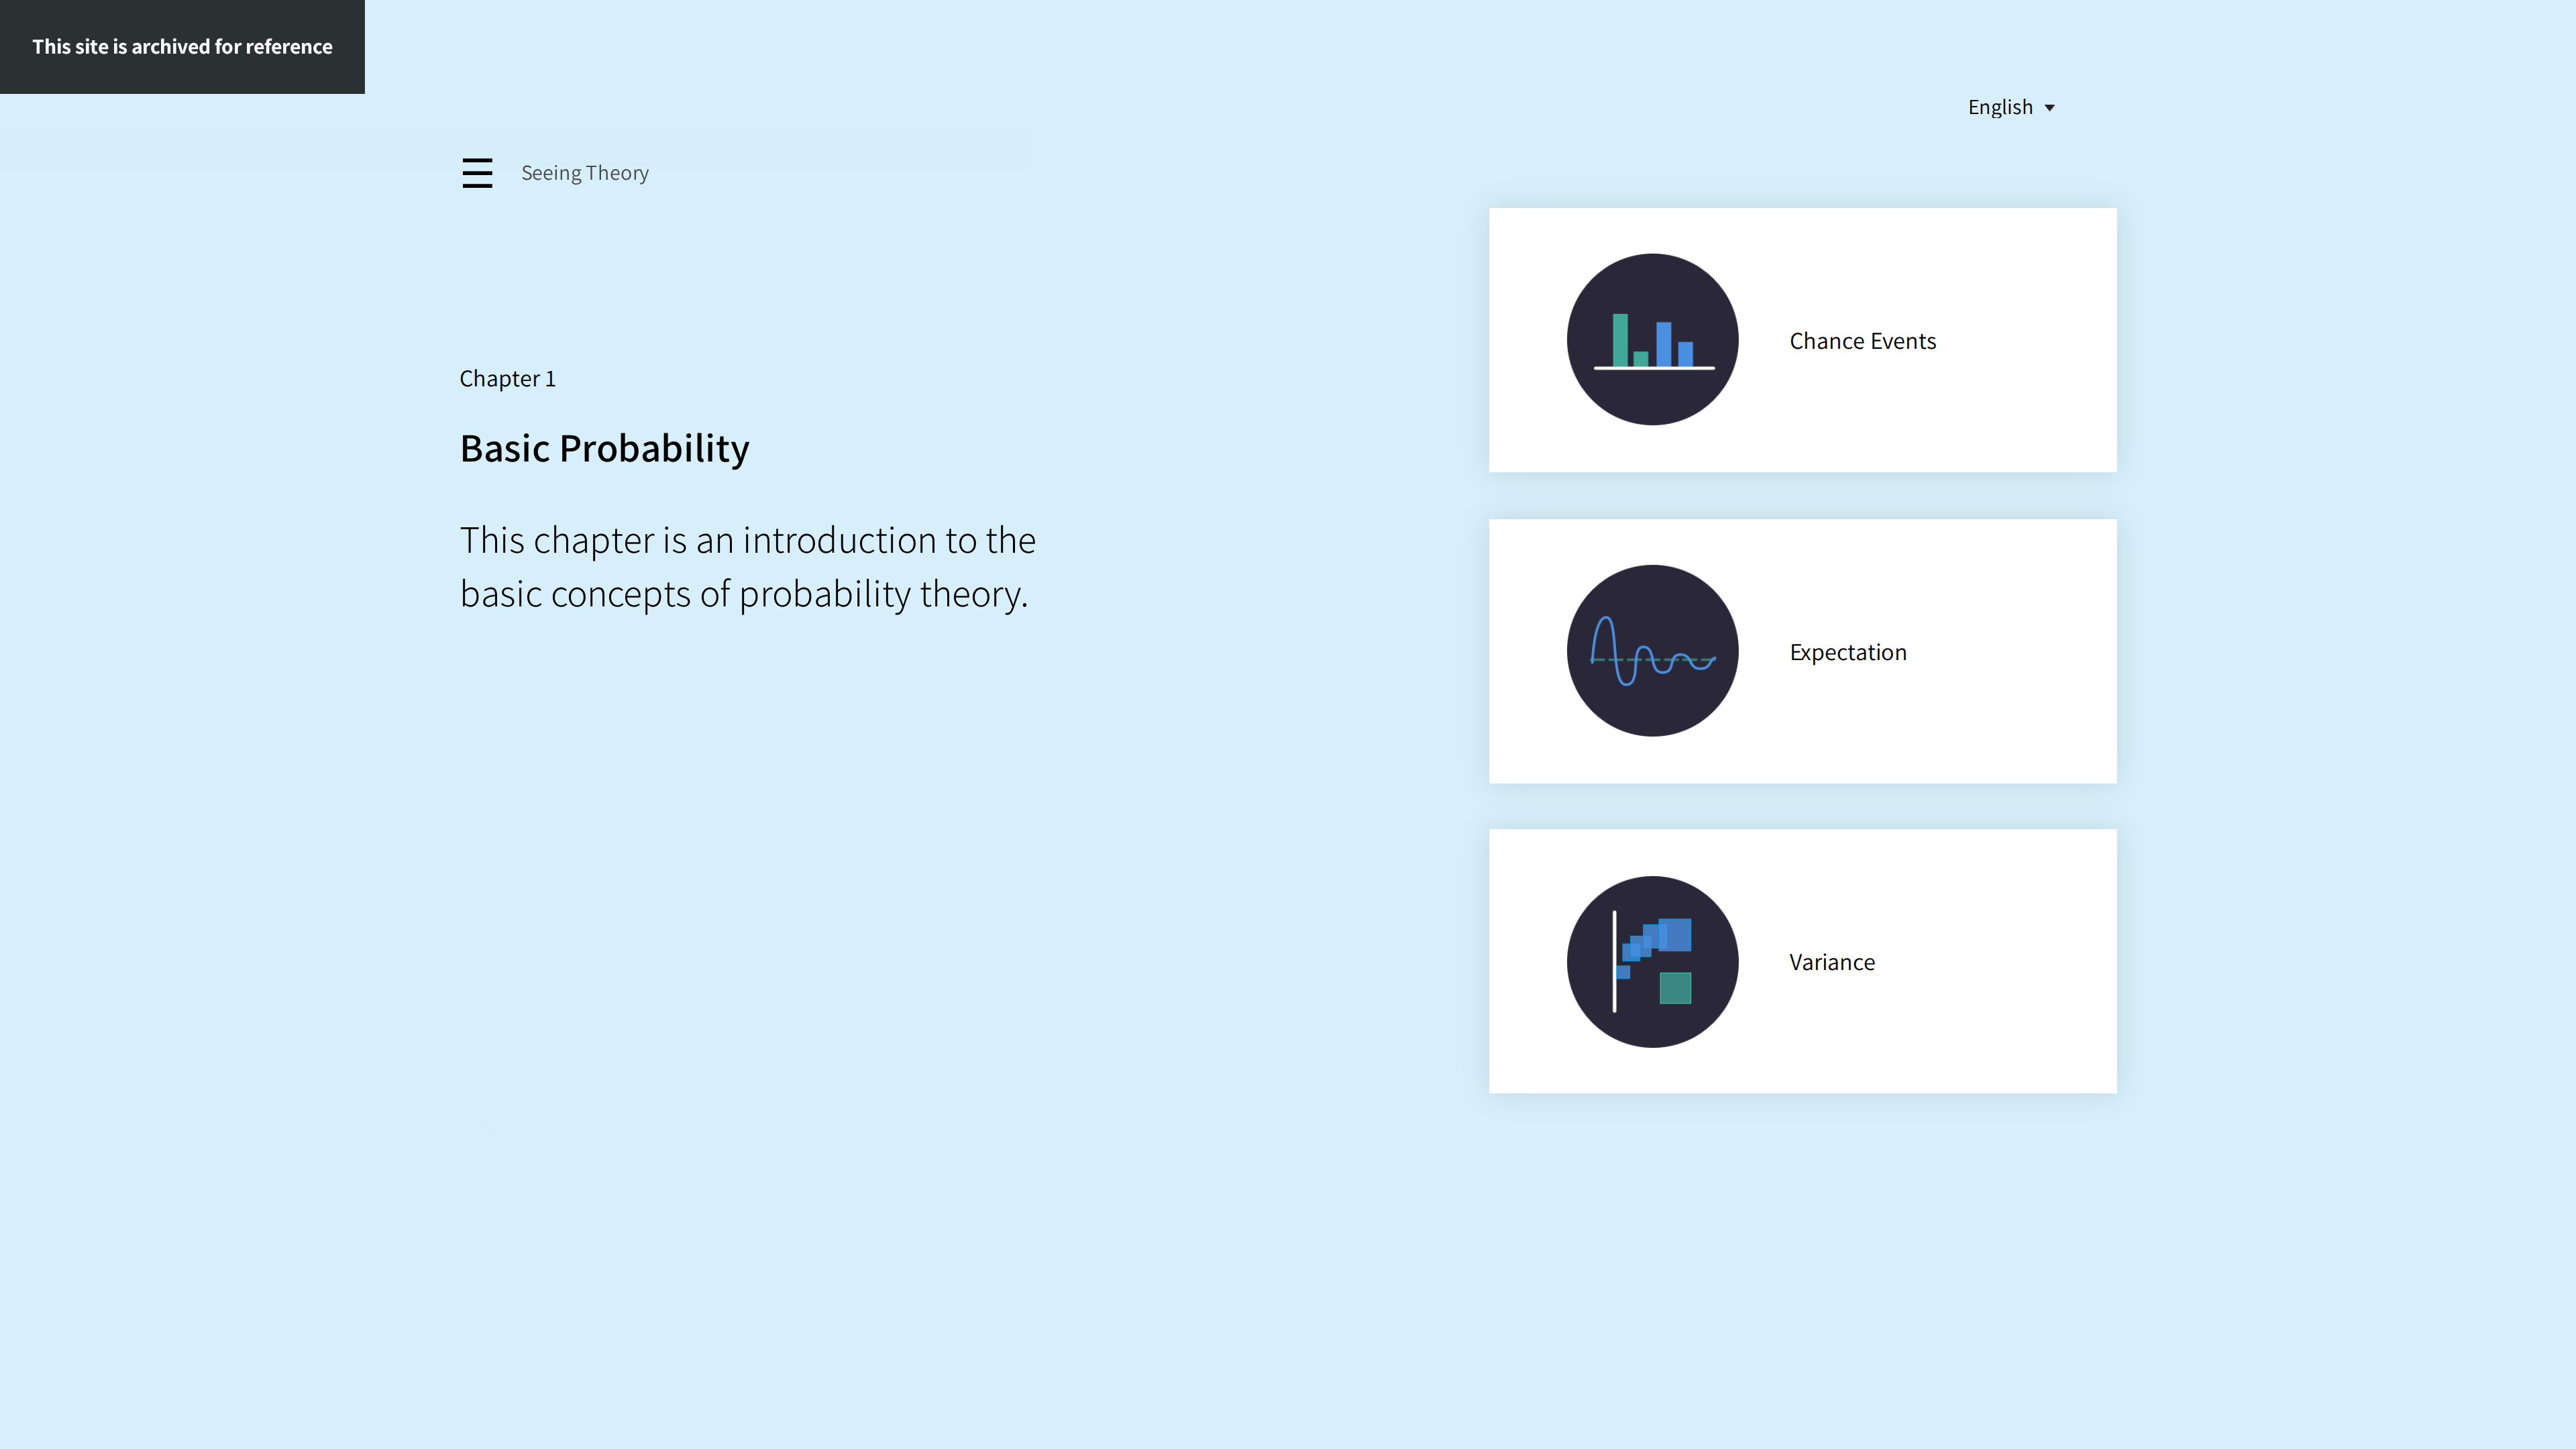
- Basic Probability: chance events, expectation, variance;
- Compound Probability: set operations, conditional probability, the gambler's fallacy;
- Probability Distributions: discrete and continuous distributions, the Central Limit Theorem;
- Frequentist Inference: point estimates, confidence intervals, bootstrapping;
- Bayesian Inference: Bayes' theorem, prior and posterior, conjugate priors;
- Regression Analysis: ordinary least squares, correlation, analysis of variance.
Good For
- Students taking probability and statistics who need visual intuition;
- Teachers demoing concepts live in class (animations run instantly, Chinese UI available);
- Data practitioners revisiting Bayes, confidence intervals and other commonly confused ideas.
Limitations
- Archived and frozen: no new chapters or corrections are coming.
- Introductory depth only — nothing beyond the six chapters (e.g. the full family of hypothesis tests, time series).
- The Chinese version is Simplified Chinese, and some interactive captions feel less polished than the English text (a browsing impression, not verified section by section).
- Built on a jQuery-era front-end stack; layout on narrow modern devices may be imperfect.