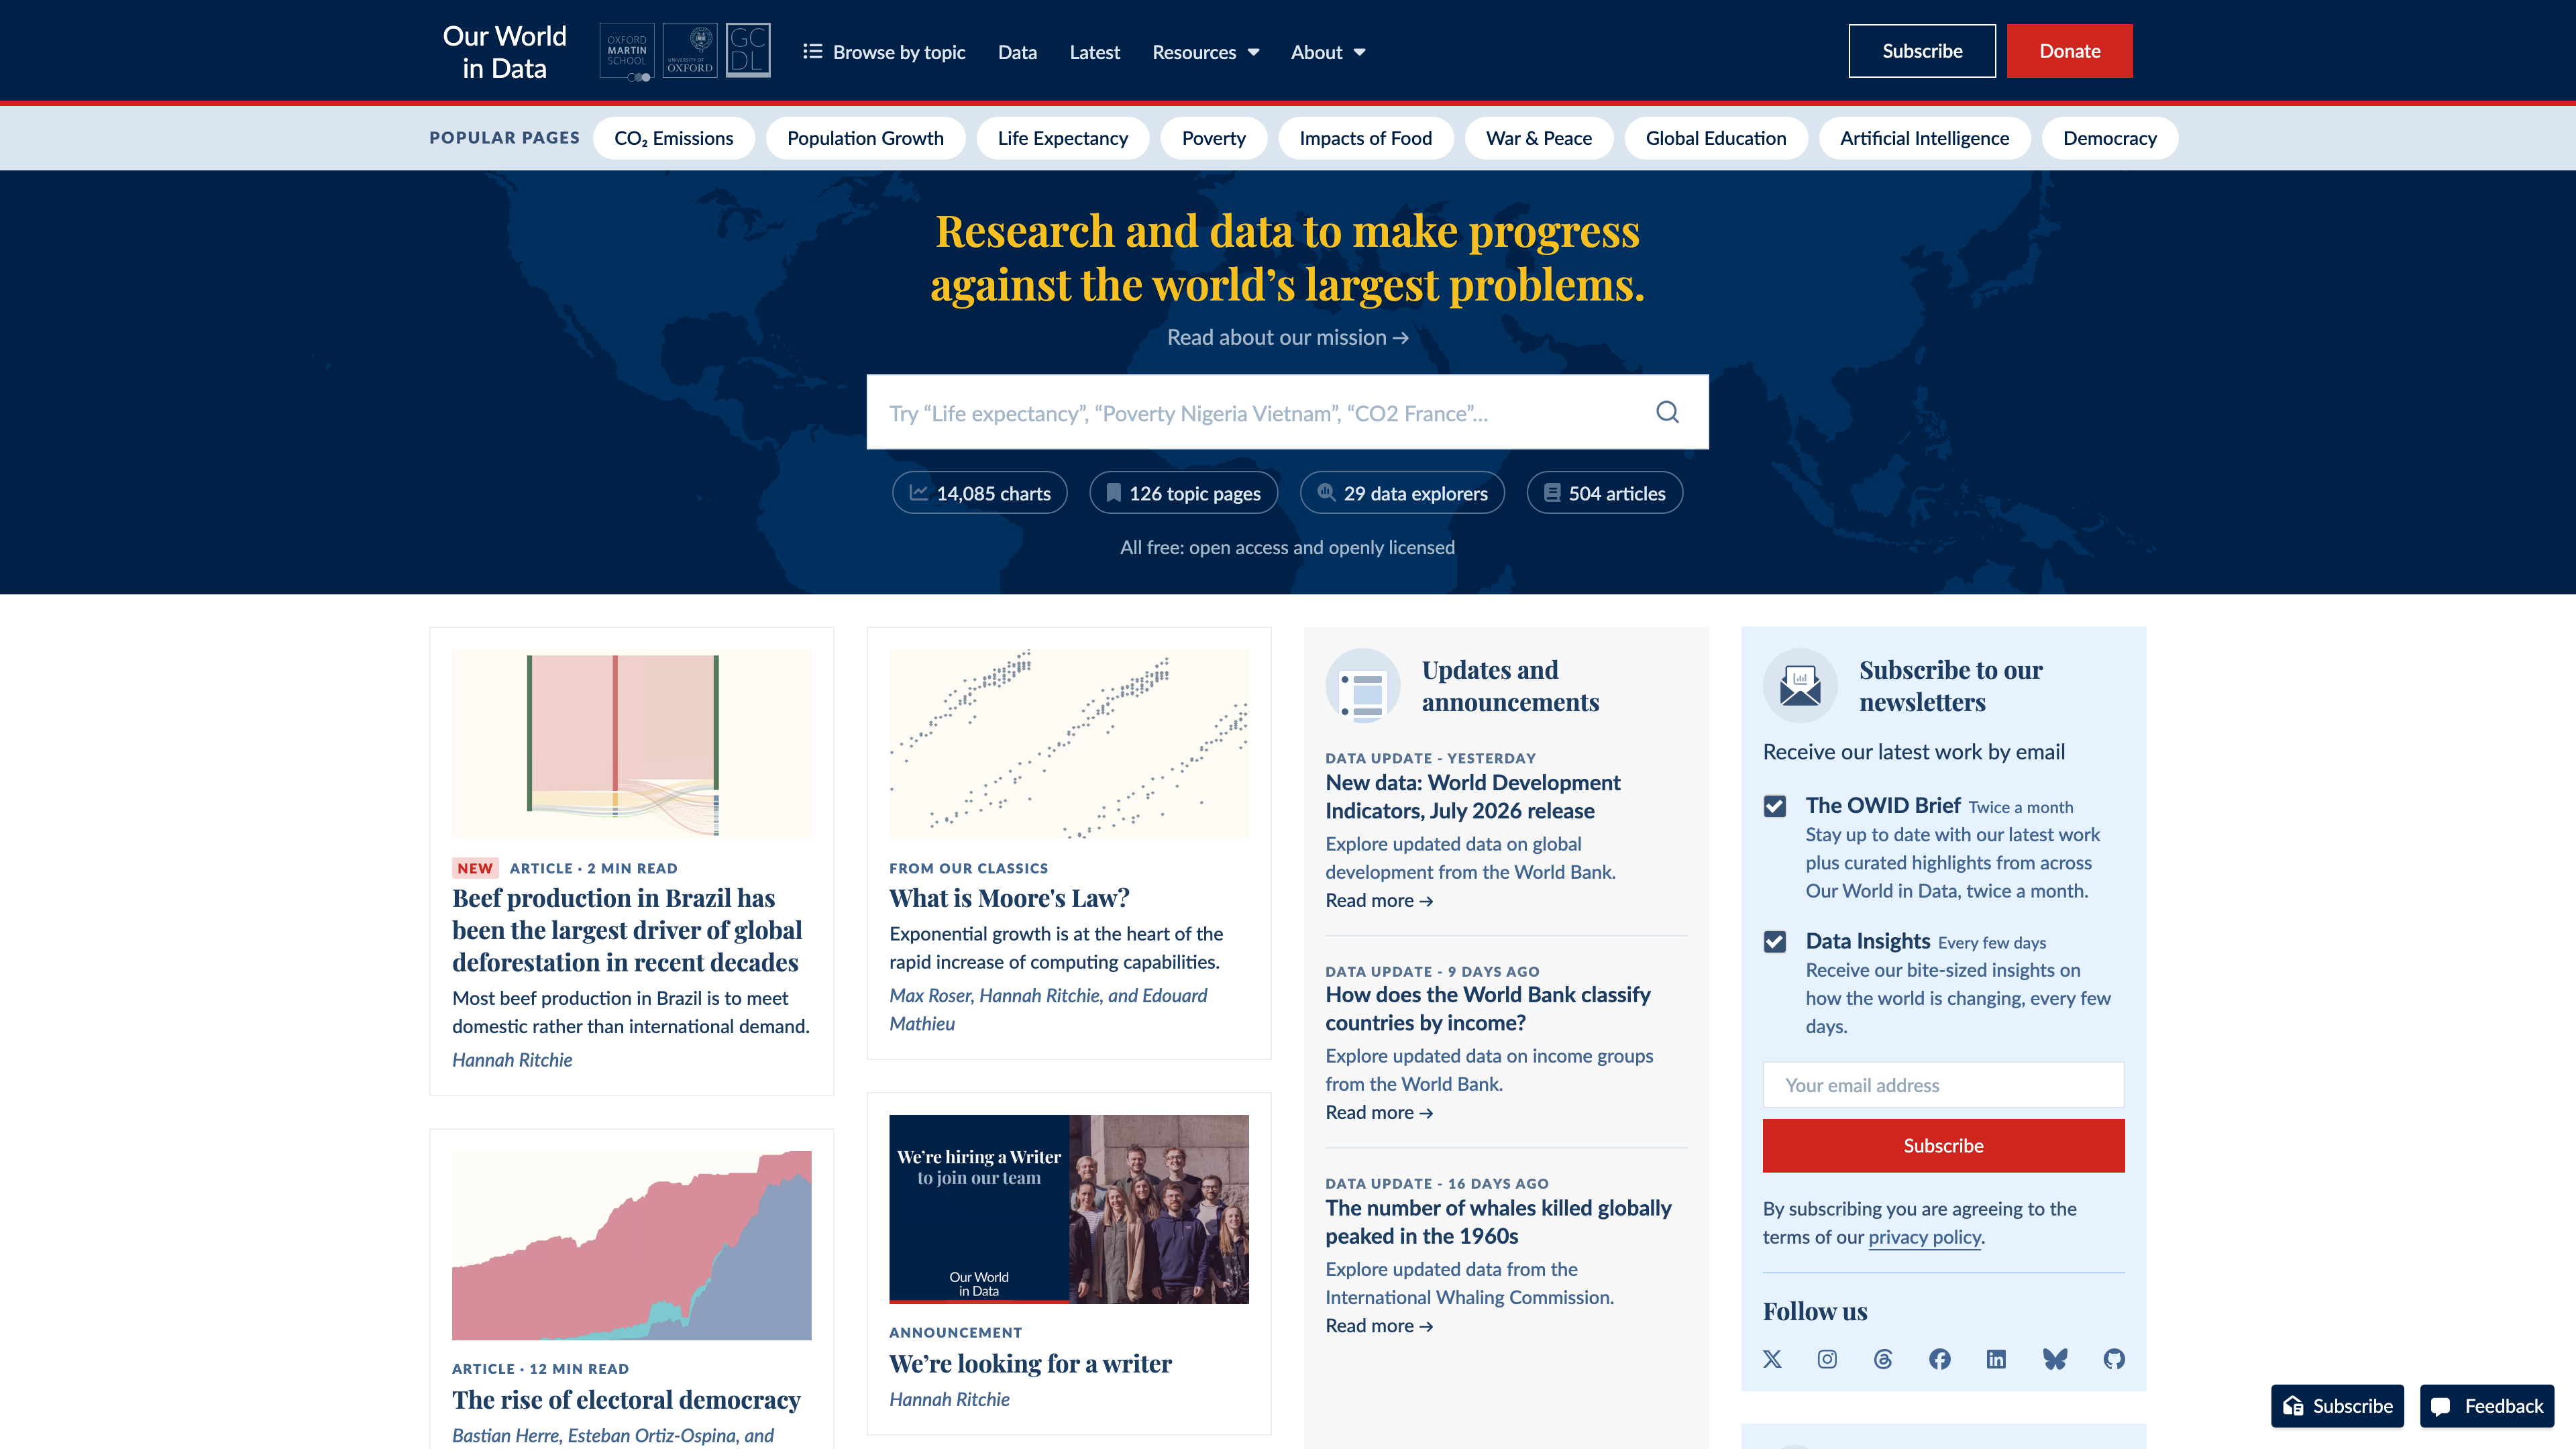
Our World in Data (often abbreviated OWID) is a free, registration-free research and data-visualization publication whose stated mission is to publish "research and data to make progress against the world's largest problems." It brings together cross-country, long-run data that otherwise sits in international institutions, academic papers and government statistics, turns it into interactive charts, and pairs it with explanatory writing. Coverage spans more than 120 topics, including poverty, CO₂ emissions and climate change, global health, population growth, democracy, armed conflict and artificial intelligence. Compared with the data portals of primary statistical agencies, its verifiable distinction is that every chart carries its source and citation, can be downloaded or embedded directly, and most charts and articles are openly licensed under CC BY.
At a glance
- URL: https://ourworldindata.org/
- Type: Non-profit research and data-visualization publication
- Cost: All content is free; no paywall
- Registration: None required to read, download or embed charts; an email address is only needed for the newsletters
- Interface language: English only; the team states in its FAQ that it cannot maintain official translations
- Scale: As of 2026-09-01, the homepage lists 14,085 charts, 126 topic pages, 29 data explorers and 504 articles
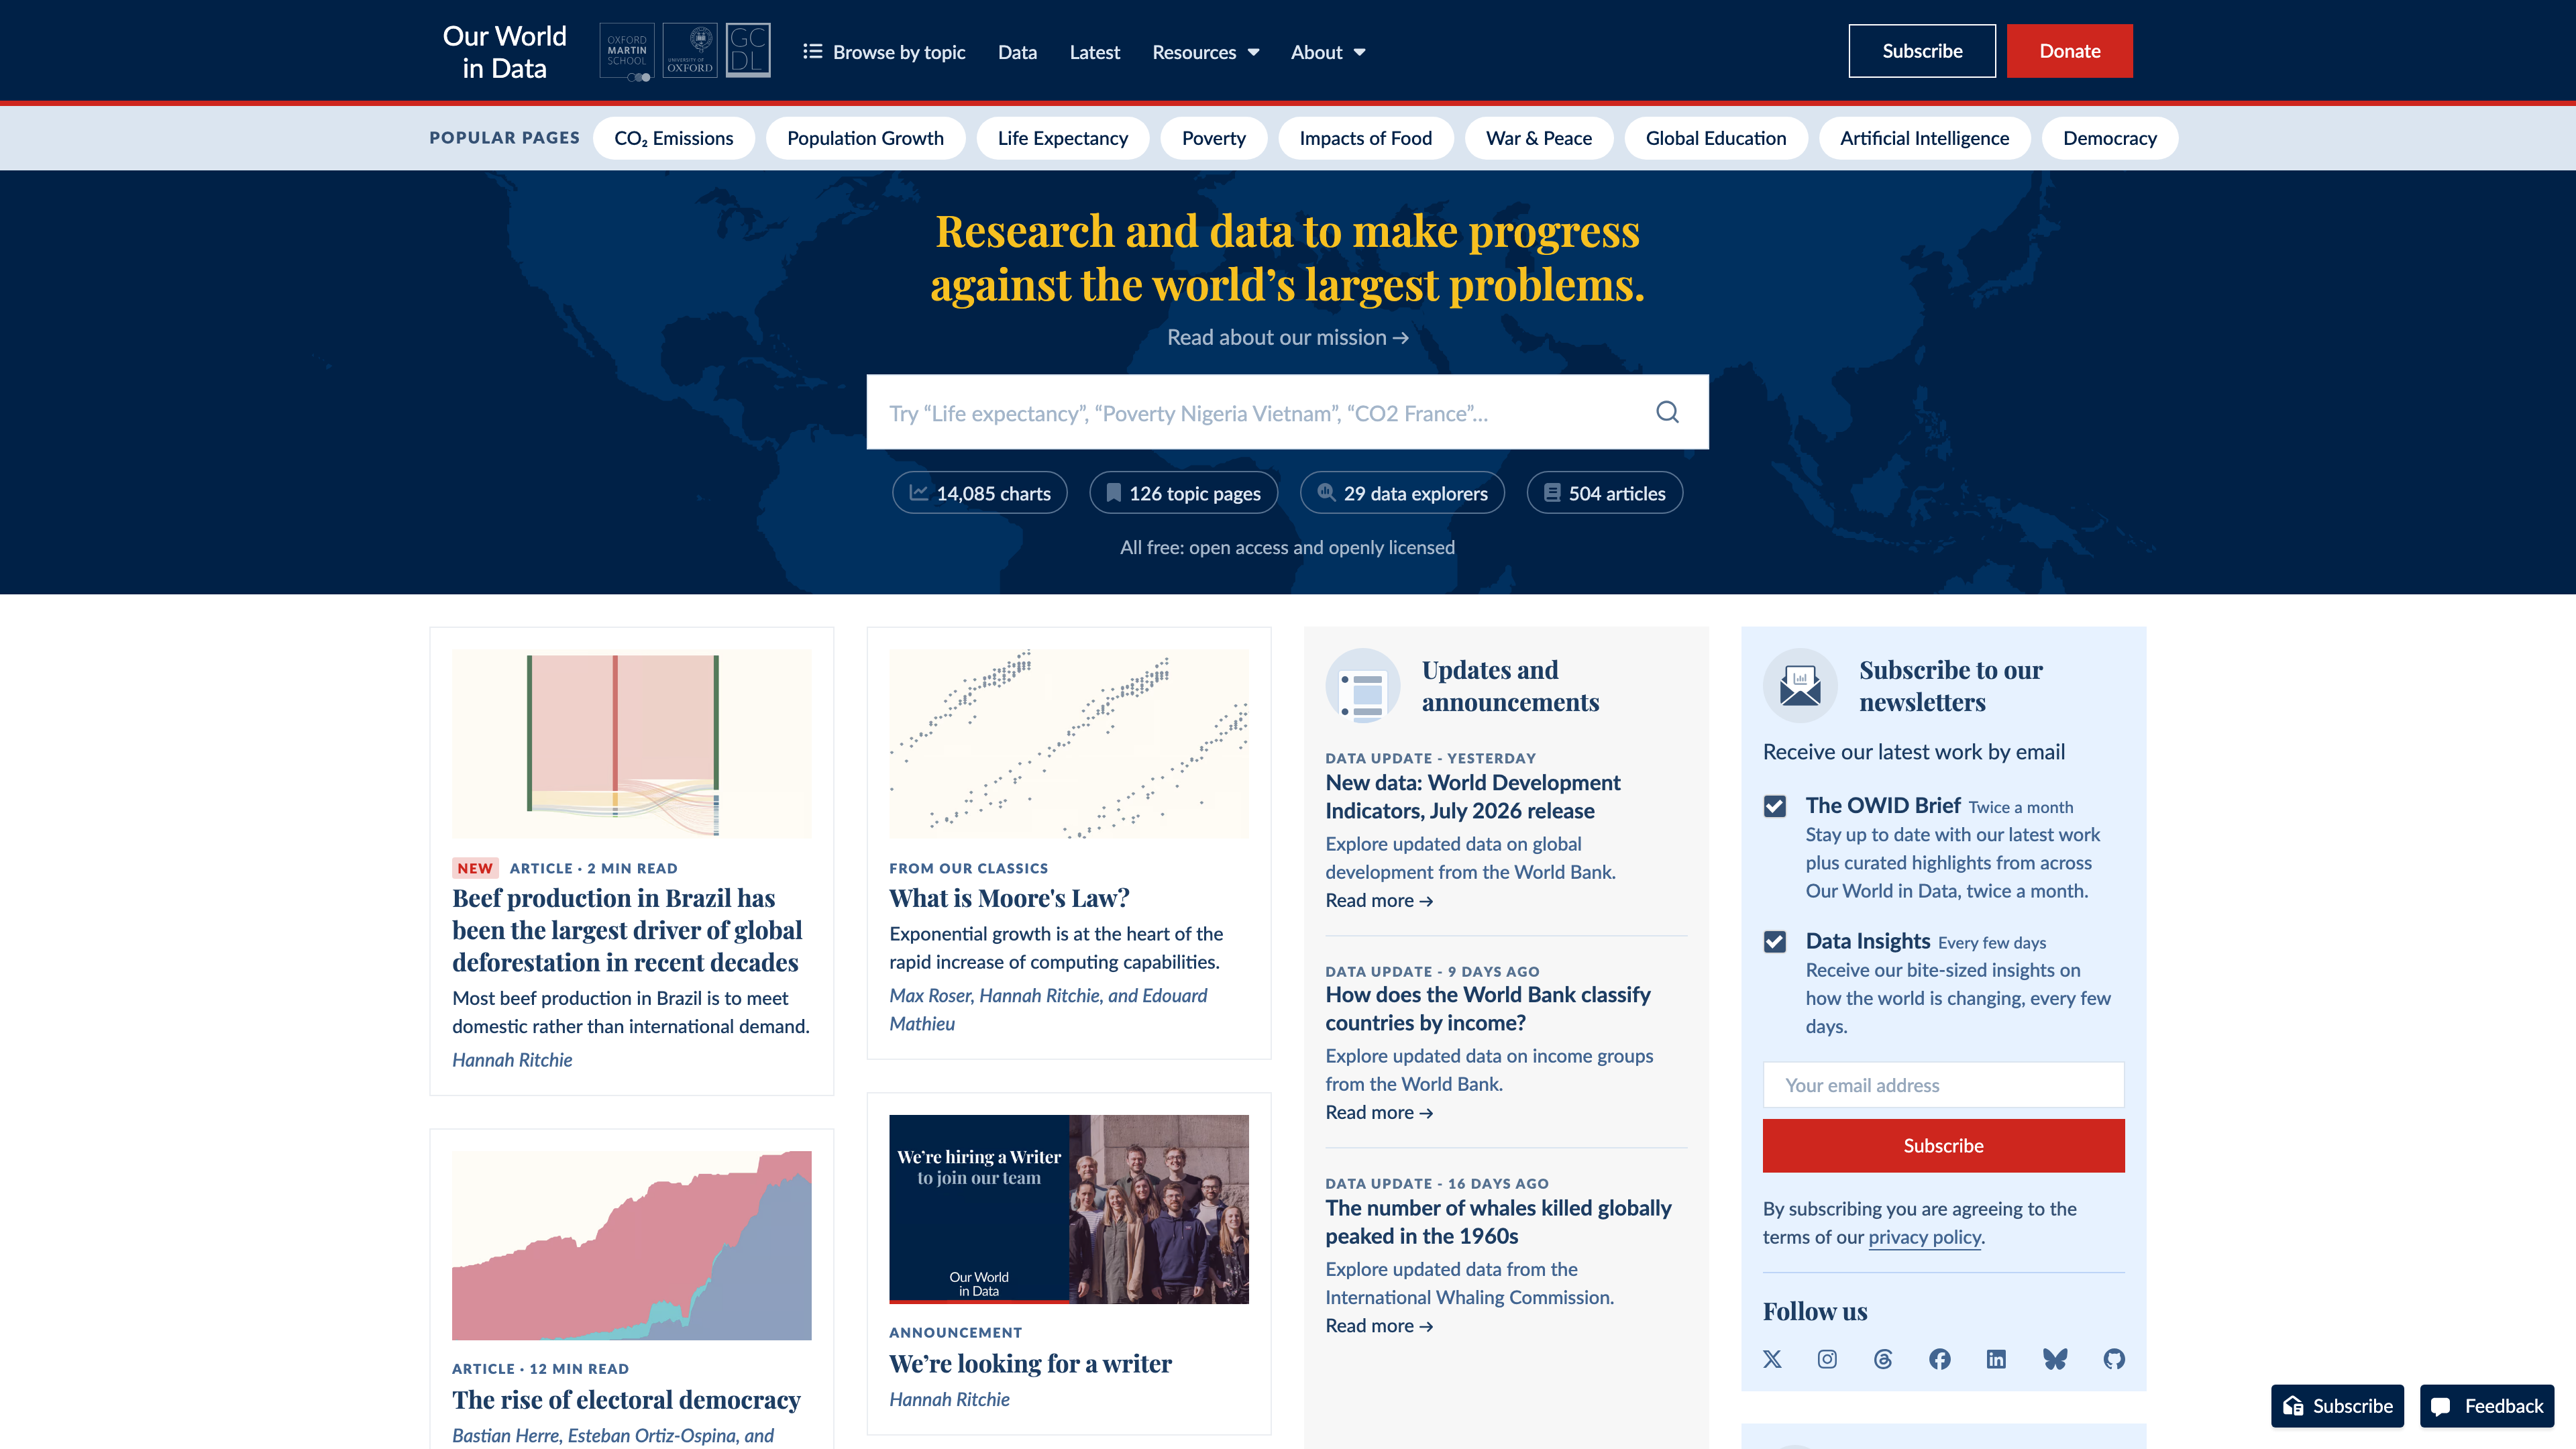
The homepage also surfaces popular topics and recent data updates, such as the July 2026 World Development Indicators release visible in the screenshot above.
Background
Oxford researcher Max Roser started the project in 2011, and the website itself launched in the summer of 2014 (official YC announcement). Today the site is owned, published and maintained by Global Change Data Lab, a registered charity in England and Wales (charity number 1186433), working with researchers affiliated with the Oxford Martin Programme on Global Development at the University of Oxford; Roser serves as co-director (About, Organization).
Funding comes from institutional grants and reader donations. The Funding page publishes donor details and an audited trustees' annual report each year, and the FAQ states that funders have no editorial oversight or control. In 2019, Our World in Data was one of the few non-profits in Y Combinator's Winter 2019 batch, with YC pledging a $100,000 donation to help it get started (official announcement).
Core capabilities
Interactive charts (Grapher). The site's charts run on its own Grapher engine: you can add or remove countries, adjust the time range, switch between linear and logarithmic axes, and move between table, map, line and bar views. Every selection is reflected in the URL, so a specific view can be shared directly. Each chart footer names the data source and how to cite it; the download button offers PNG and SVG, and appending .csv to a chart URL returns the full underlying dataset (FAQ).
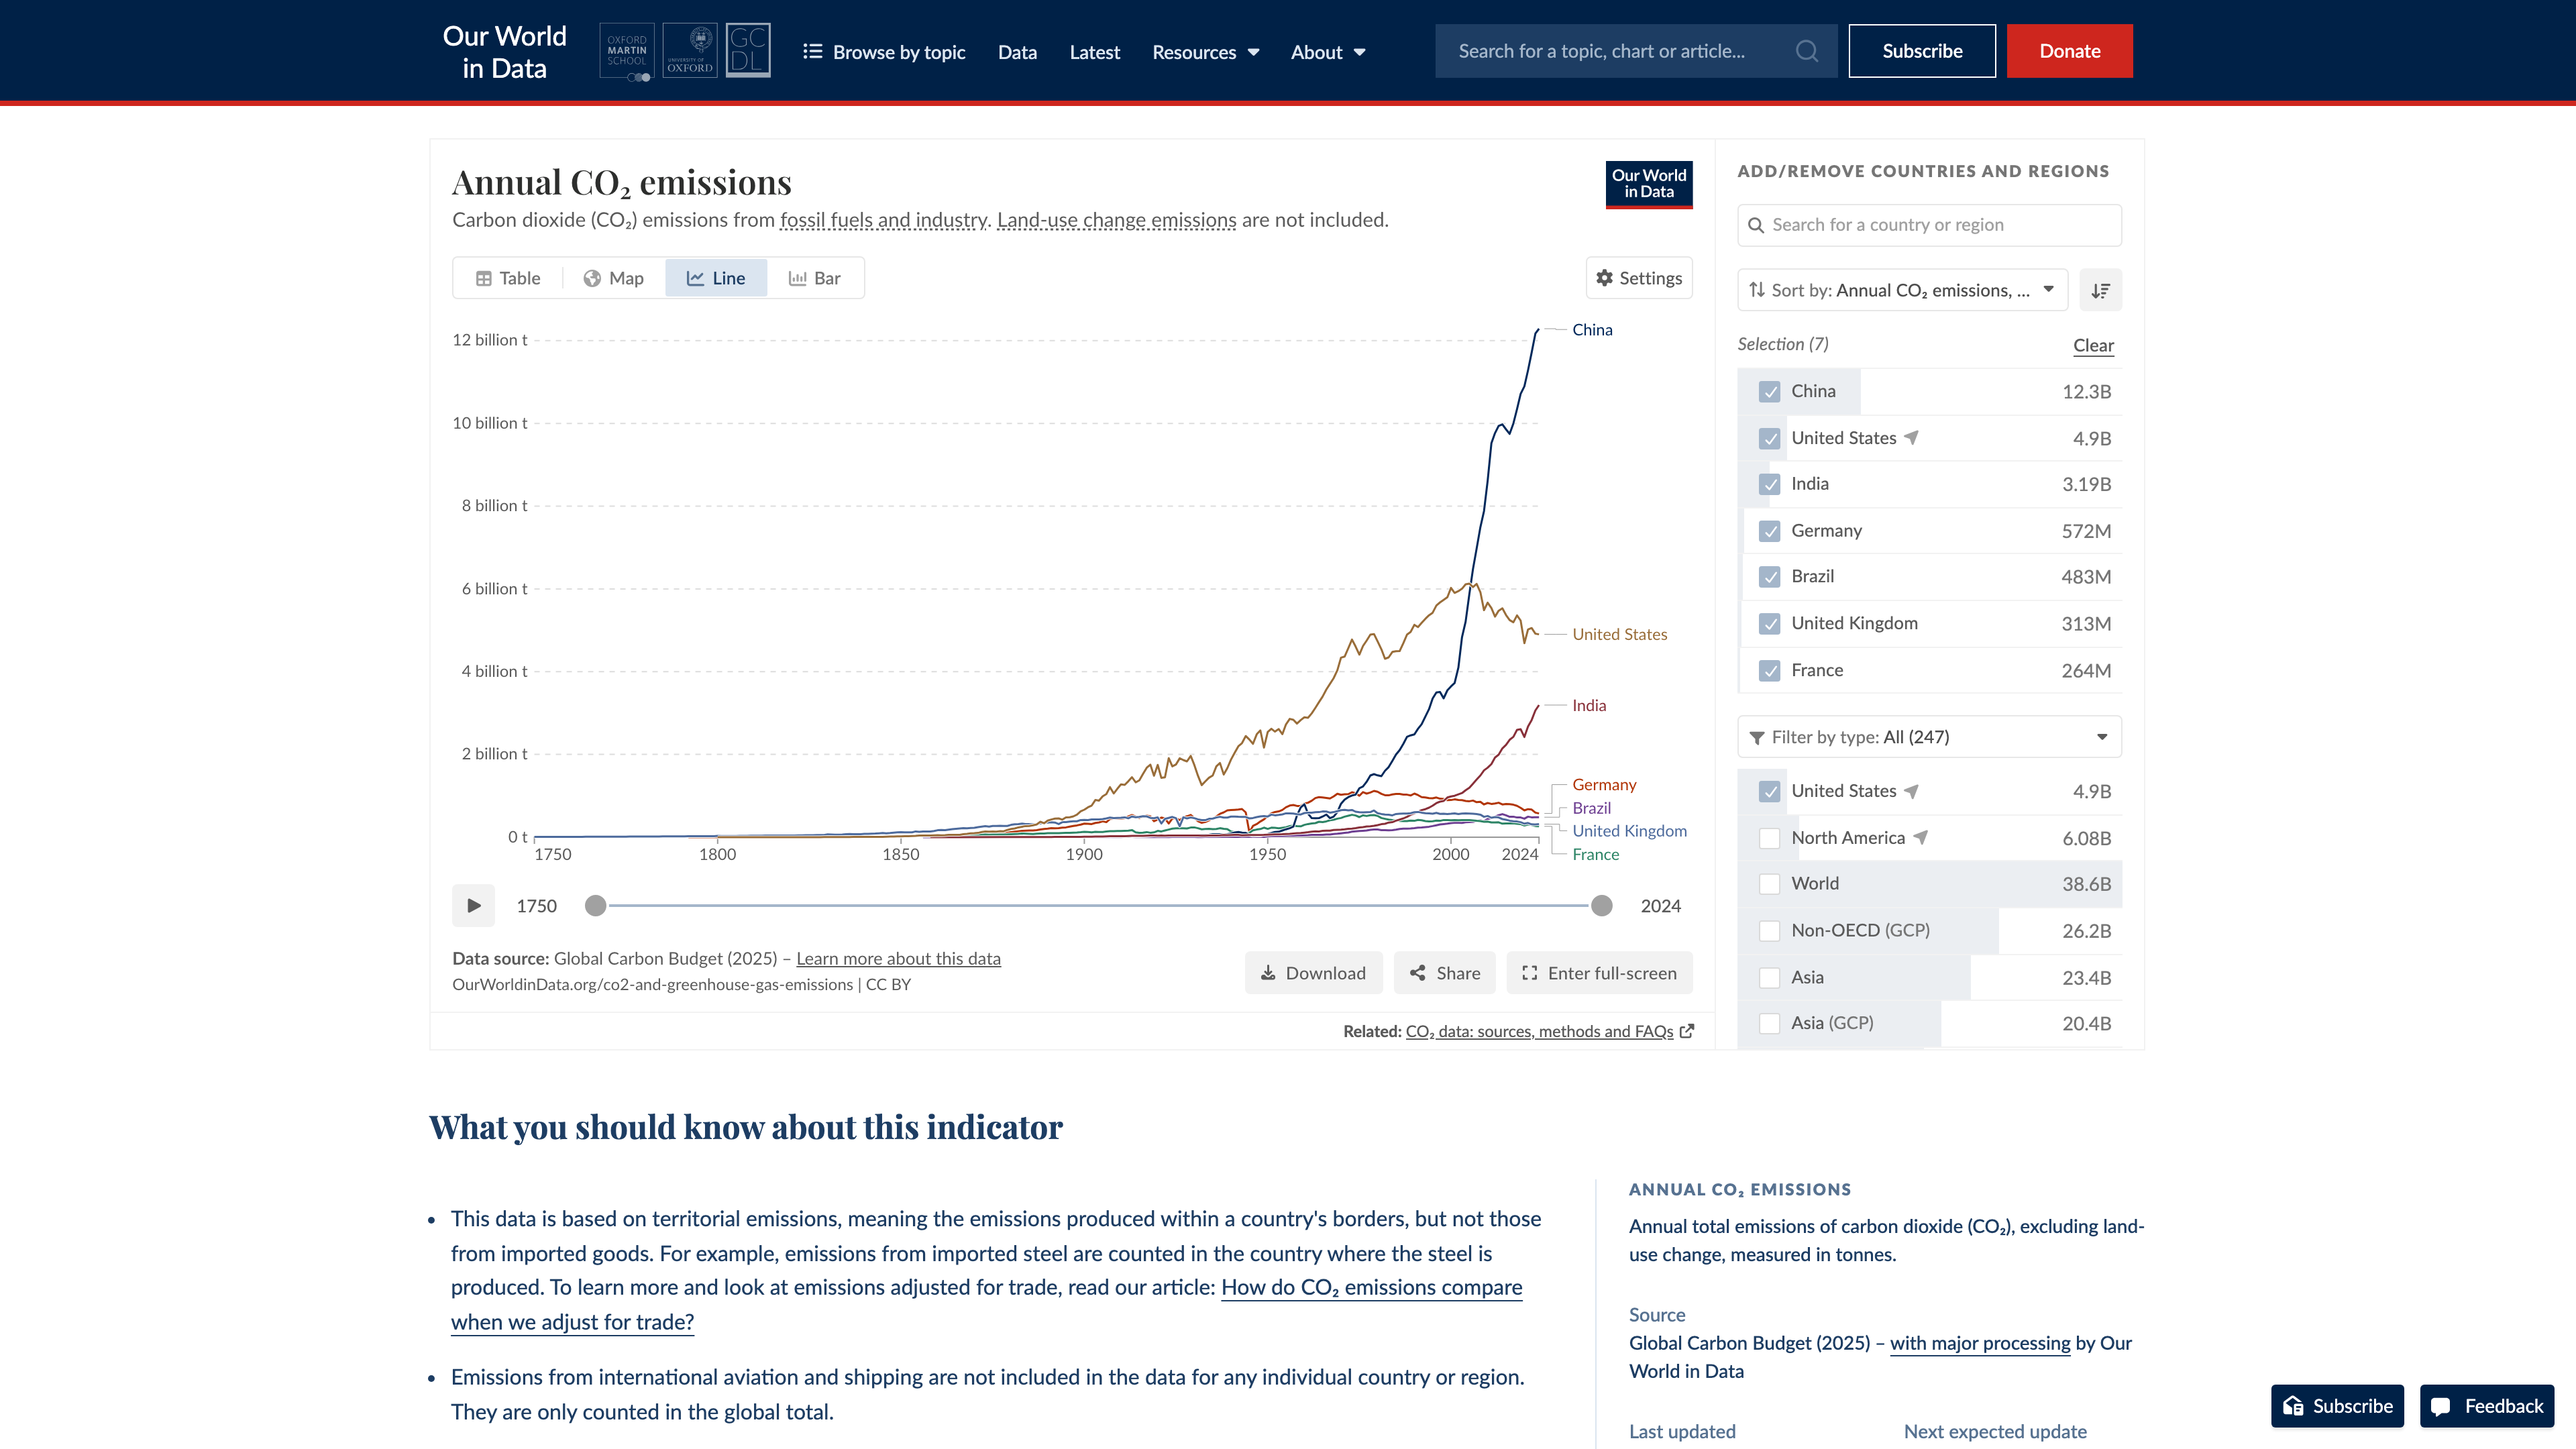
Embedding and sharing. Share → Embed on any chart produces an iframe snippet, available either as a live embed that updates with the data or an archived embed frozen at the current state. The terms ask that embeds not be modified, for example by forcing cookie consent before the chart renders (FAQ).
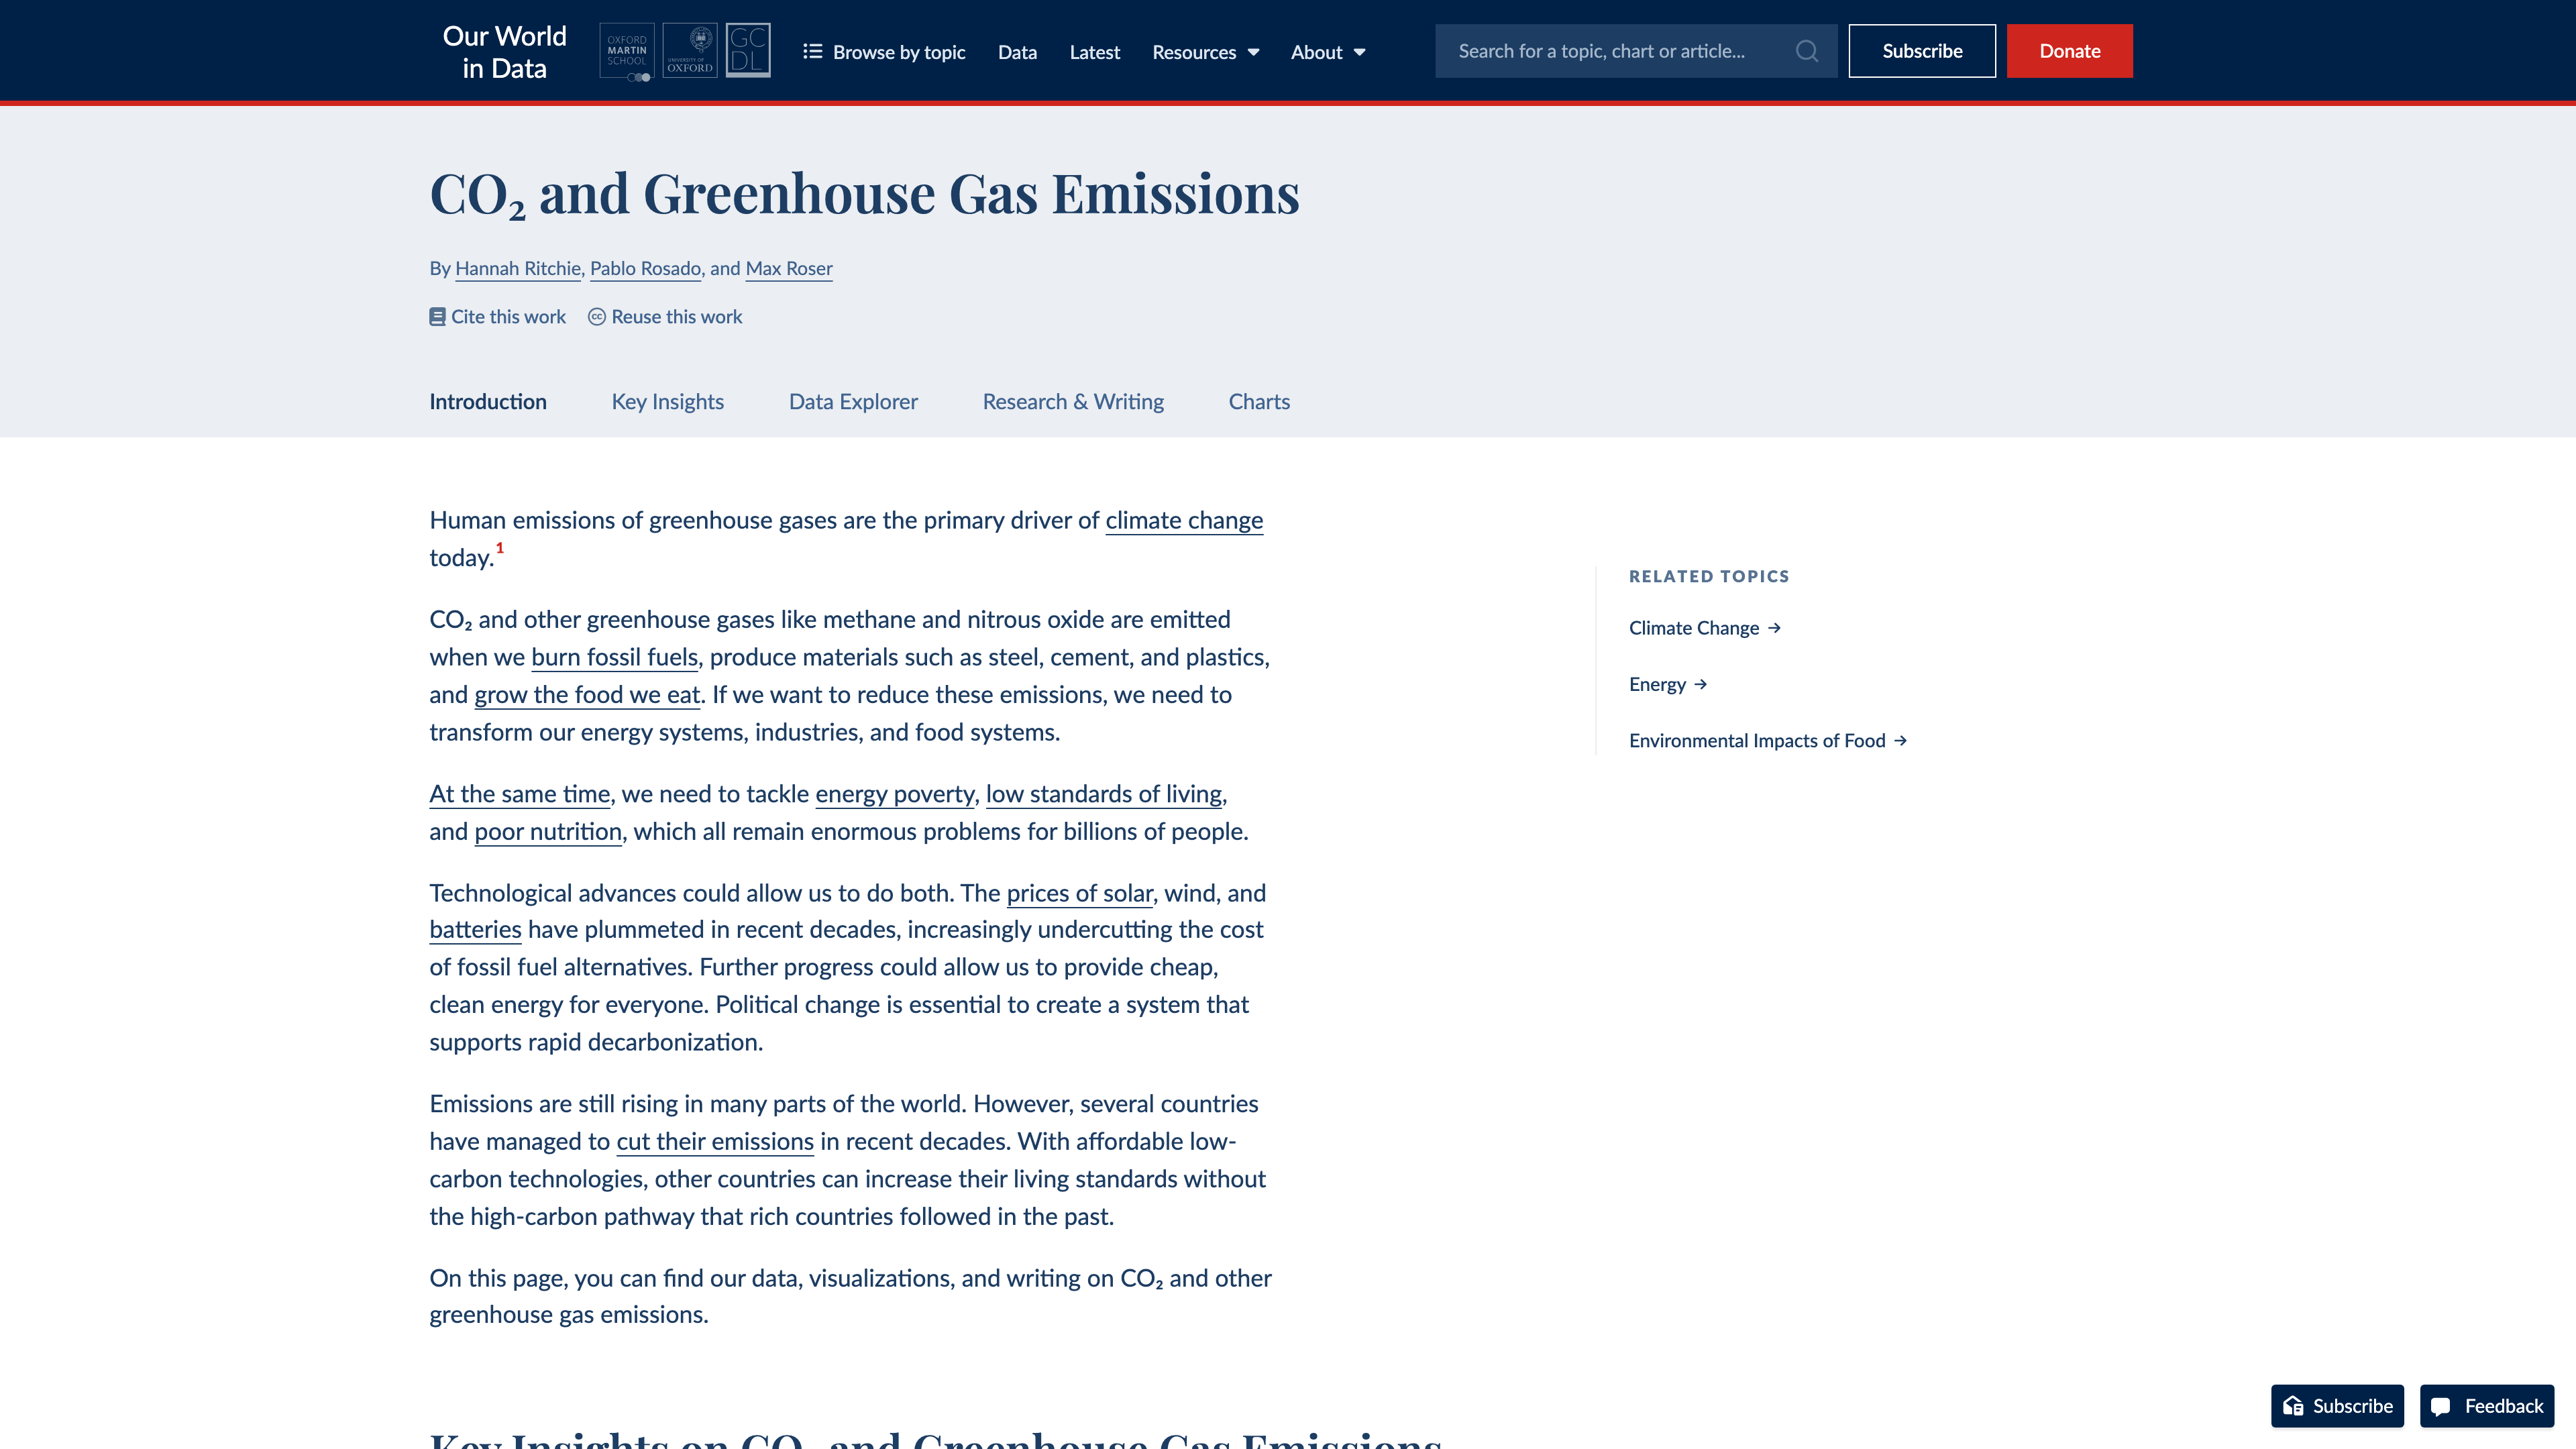
Topic pages and articles. Content is organized into more than 120 topics (About); each topic page aggregates key insights, charts, data explorers and long-form writing for that subject. Shorter Data Insights pieces highlight individual findings every few days.
Open data access. The official data documentation lists four APIs: a Charts API for chart data and metadata, a Tables API for catalog tables, an Indicators API for semantic indicator search and a Search API for charts and datasets, plus an owid-catalog Python library; the docs note these APIs are under active development (Data access documentation). File-level datasets are served directly from catalog.ourworldindata.org.
Teaching resources. The Teaching Hub provides lecture notes and slides built on the site's charts, which are also used in textbooks such as CORE Econ.
Reuse and licensing policy
The FAQ sets out the reuse rules in detail:
- Charts: unless stated otherwise, any chart carrying the Our World in Data credit and a CC BY notice may be used, copied and redistributed freely, provided it is cited in the format given on the page; no separate permission is needed.
- Articles: may be republished online or in print for free, with author attribution, an "Originally published by ... at Our World in Data" notice, a link back to the original and no substantive edits.
- Data: the license of the original source applies. Most data comes from third parties such as the WHO, UN agencies and the World Bank and remains subject to their terms; data marked "Official data collated by Our World in Data" or "with major processing by Our World in Data" is available under CC BY. Each chart's "Learn more about this data" note gives the exact citation.
- Name and logo: may only be used as they appear on the charts and articles themselves; standalone use of the logo or anything implying endorsement is not allowed.
- Third-party material: a small number of charts come from third parties (for example, World Bank report figures) and keep their own licenses, which must be checked individually.
Open tooling and source-code status
The code lives in the owid GitHub organization, but licensing differs by repository and should be checked before reuse:
- The chart engine owid-grapher has about 1.6k stars as of 2026-09-01 and is actively developed. Note the license change: it was published under MIT from October 2022, then switched to a proprietary license in May 2026 that permits viewing and learning but no copying, modification or redistribution without written permission (LICENSE.md).
- The data pipeline owid/etl remains MIT-licensed and actively maintained, with documentation at docs.owid.io.
- The widely used owid/covid-19-data repository is archived; its GitHub data stopped updating on 2024-08-19 and the datasets moved into the ETL catalog (official migration notice). As of 2026-09-01, the catalog version's records run through 2026-07-19.
When it is useful
- Finding freely reusable charts on global issues for articles, reports or courseware, with ready-made citations.
- Getting up to speed on a cross-country, long-run topic — extreme poverty, the energy transition, vaccination — through curated trends and key figures.
- Pulling cleaned cross-country time series in bulk via the APIs or direct CSV links for your own analysis or visualization.
- Teaching with reliable, clearly sourced data examples.
Limitations
- English only: there is no official Chinese or other-language version. Personal translations are permitted under CC BY but carry no official endorsement.
- Not a primary data producer: most data originates from third-party institutions, so accuracy and release cadence depend on upstream sources, and each dataset's license must be checked at the source before reuse.
- Updates are not real-time: regular topics follow upstream release cycles, and the daily GitHub COVID updates ended in August 2024.
- Macro-level scope: coverage centers on cross-country, long-run development issues; company-level or commercial market data is out of scope.
- The Grapher engine is no longer open source: since the May 2026 license change it cannot be reused as a freely self-hostable charting tool.
Related references
- World Bank Open Data, UNdata, OECD Data: the data portals of the primary statistical agencies that Our World in Data itself names as its main upstream sources. These portals publish the raw statistics; Our World in Data builds curation, visualization and interpretation on top of them. For authoritative indicator definitions or unprocessed figures, go back to these sources.
References
- About – Our World in Data (checked 2026-09-01)
- Funding – Our World in Data (checked 2026-08-30)
- Frequently asked questions – Our World in Data (checked 2026-08-30)
- Organization – Our World in Data (checked 2026-08-30)
- Our World in Data is at Y Combinator (checked 2026-08-30)
- Data access documentation – ETL & API (checked 2026-08-30)
- owid/owid-grapher – GitHub (incl. LICENSE.md) (checked 2026-09-01)
- owid/covid-19-data issue #2841: dataset migration notice (checked 2026-08-30)