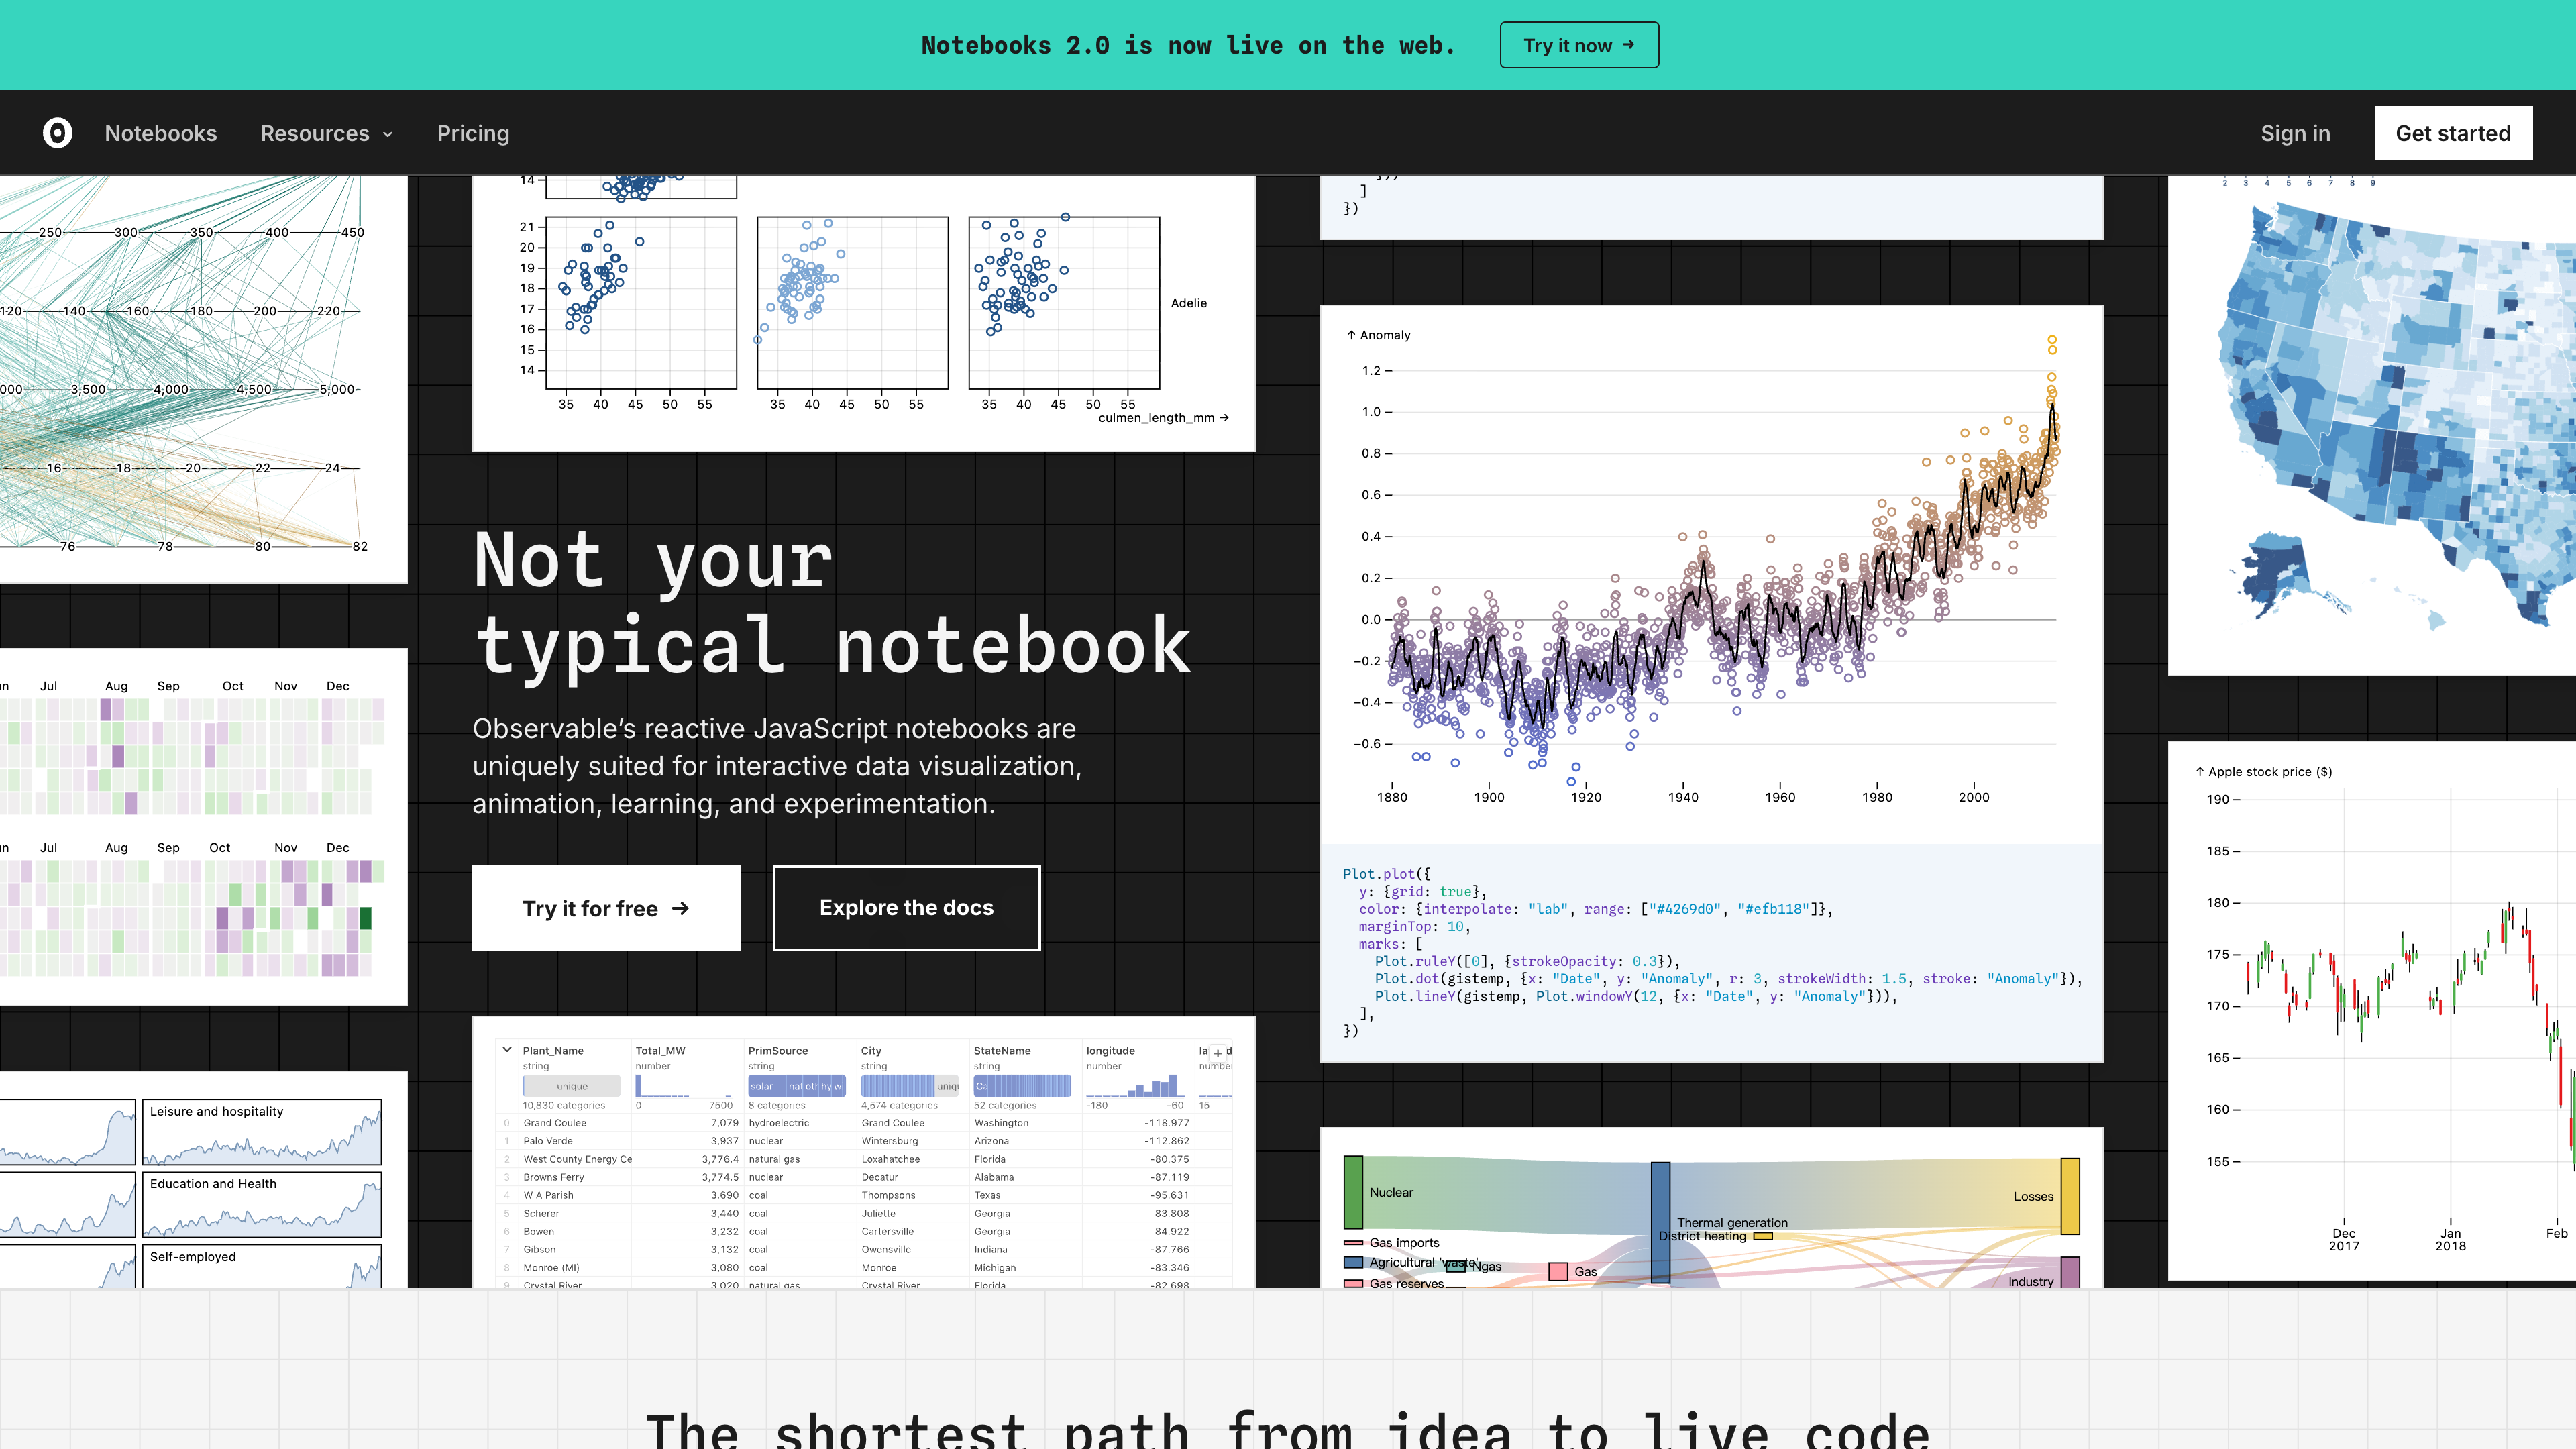
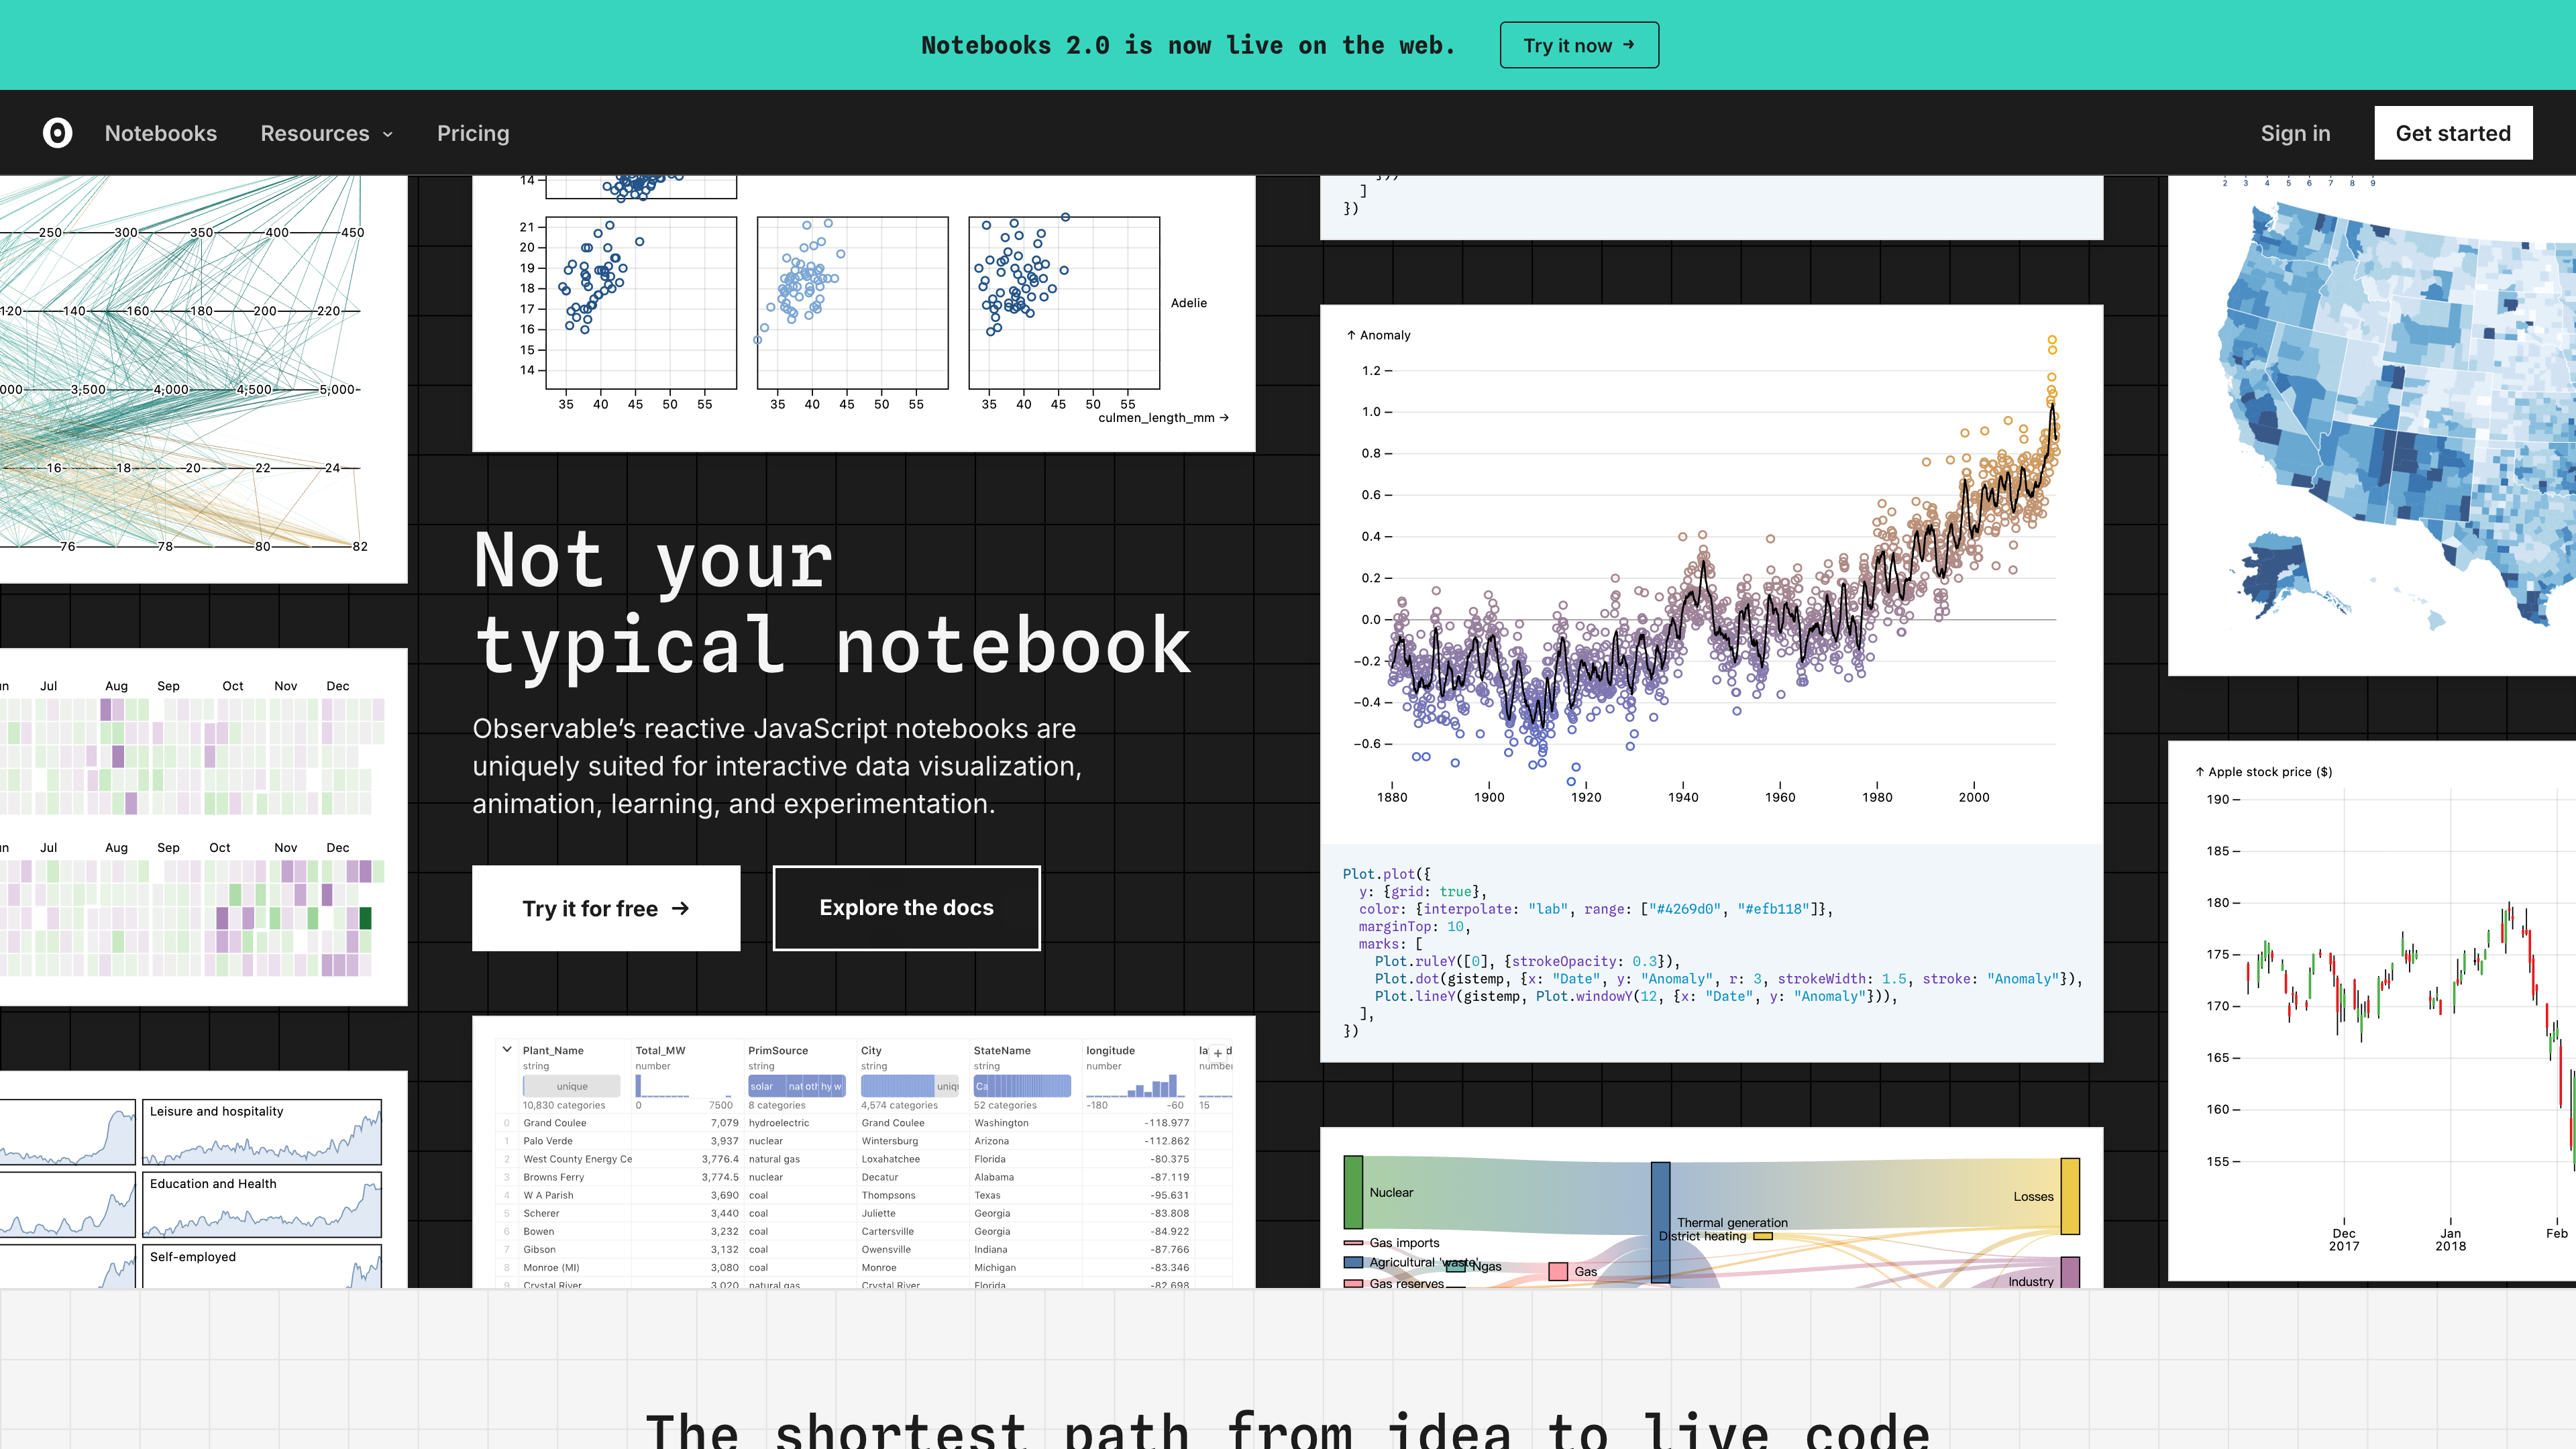
Observable is a web platform built around exploring data with code. In the browser, you write reactive notebooks made of JavaScript, Markdown, HTML, and SQL cells; charts update live as you work; and the results can be shared or embedded anywhere on the web. The company was co-founded by Mike Bostock, creator of the D3.js visualization library, and the platform says more than a million notebooks have been created on it. Observable also maintains widely used open-source projects including D3, Observable Plot, and Observable Framework. If you want to build interactive data visualizations, data journalism, dashboards, or technical tutorials with code, it belongs on your shortlist.
At a glance
- URL: https://observablehq.com/
- Type: Data visualization notebook platform + open-source visualization toolchain
- Cost: Free tier available; Notebook Pro at 10/month each; Enterprise plans also exist (pricing page, as of 2026-08-31)
- Sign-up: Public notebooks can be read without an account; creating notebooks requires registration via email, Google, GSuite, Microsoft, or GitHub; users must be at least 13 years old (Terms of Service)
- Interface language: English
Background
Observable grew out of d3.express, an "integrated discovery environment" Mike Bostock introduced in 2017. The company was founded in 2016 by Bostock and former Google VP of Engineering Melody Meckfessel, and the platform opened in public beta on January 31, 2018. Bostock, the author of D3.js and a former graphics editor at The New York Times, gave Observable deep ties to the data journalism and visualization communities from day one.
On the business side, Observable raised a $10.5M Series A in November 2020 led by Sequoia and Acrew, followed by a $35.6M Series B in January 2022 led by Menlo Ventures. According to its About page, the company is remote-first and currently led by co-CEOs Mike Bostock and Julio Avalos.
The product line has gone through two major shifts in recent years:
- February 2024: Observable launched "Observable 2.0", centered on Observable Framework, an open-source static site generator that extends the platform from hosted notebooks to self-hosted data apps.
- July 2025: The Notebooks 2.0 technology preview introduced an open, HTML-based notebook file format, the open-source Notebook Kit CLI, and Observable Desktop, a macOS editor. As of 2026-08-31, the homepage banner reads "Notebooks 2.0 is now live on the web," marking the new web editor as generally available.
Notebooks: living data documents in the browser
Notebooks are the heart of Observable. Unlike Jupyter-style notebooks that run on a local or server-side kernel, Observable notebooks run entirely in the browser — no environment setup — with built-in reactivity: edit any cell or drag a slider, and every downstream cell that depends on it recomputes and redraws automatically. The official documentation highlights:
- Mixed cell types: Markdown prose alongside JavaScript, SQL, and HTML cells, plus Observable Inputs (dropdowns, sliders, tables, and more) for quickly wiring up interactive charts;
- Data access: drag-and-drop file attachments, API connections, and database connectors for BigQuery, Snowflake, DuckDB, PostgreSQL, and others (as of 2026-08-31 the pricing table lists database, cloud file, and web API access in both the Free and Pro tiers);
- Collaboration: real-time multiplayer editing, comments, automatic version history, forking and merging, and importing cells from other people's notebooks to reuse code;
- Sharing and embedding: public notebooks are directly accessible, embeddable as iframes, or importable into your own app as reactive JavaScript modules;
- AI Assist: in-notebook help for writing code and fixing errors, included in the Free tier.
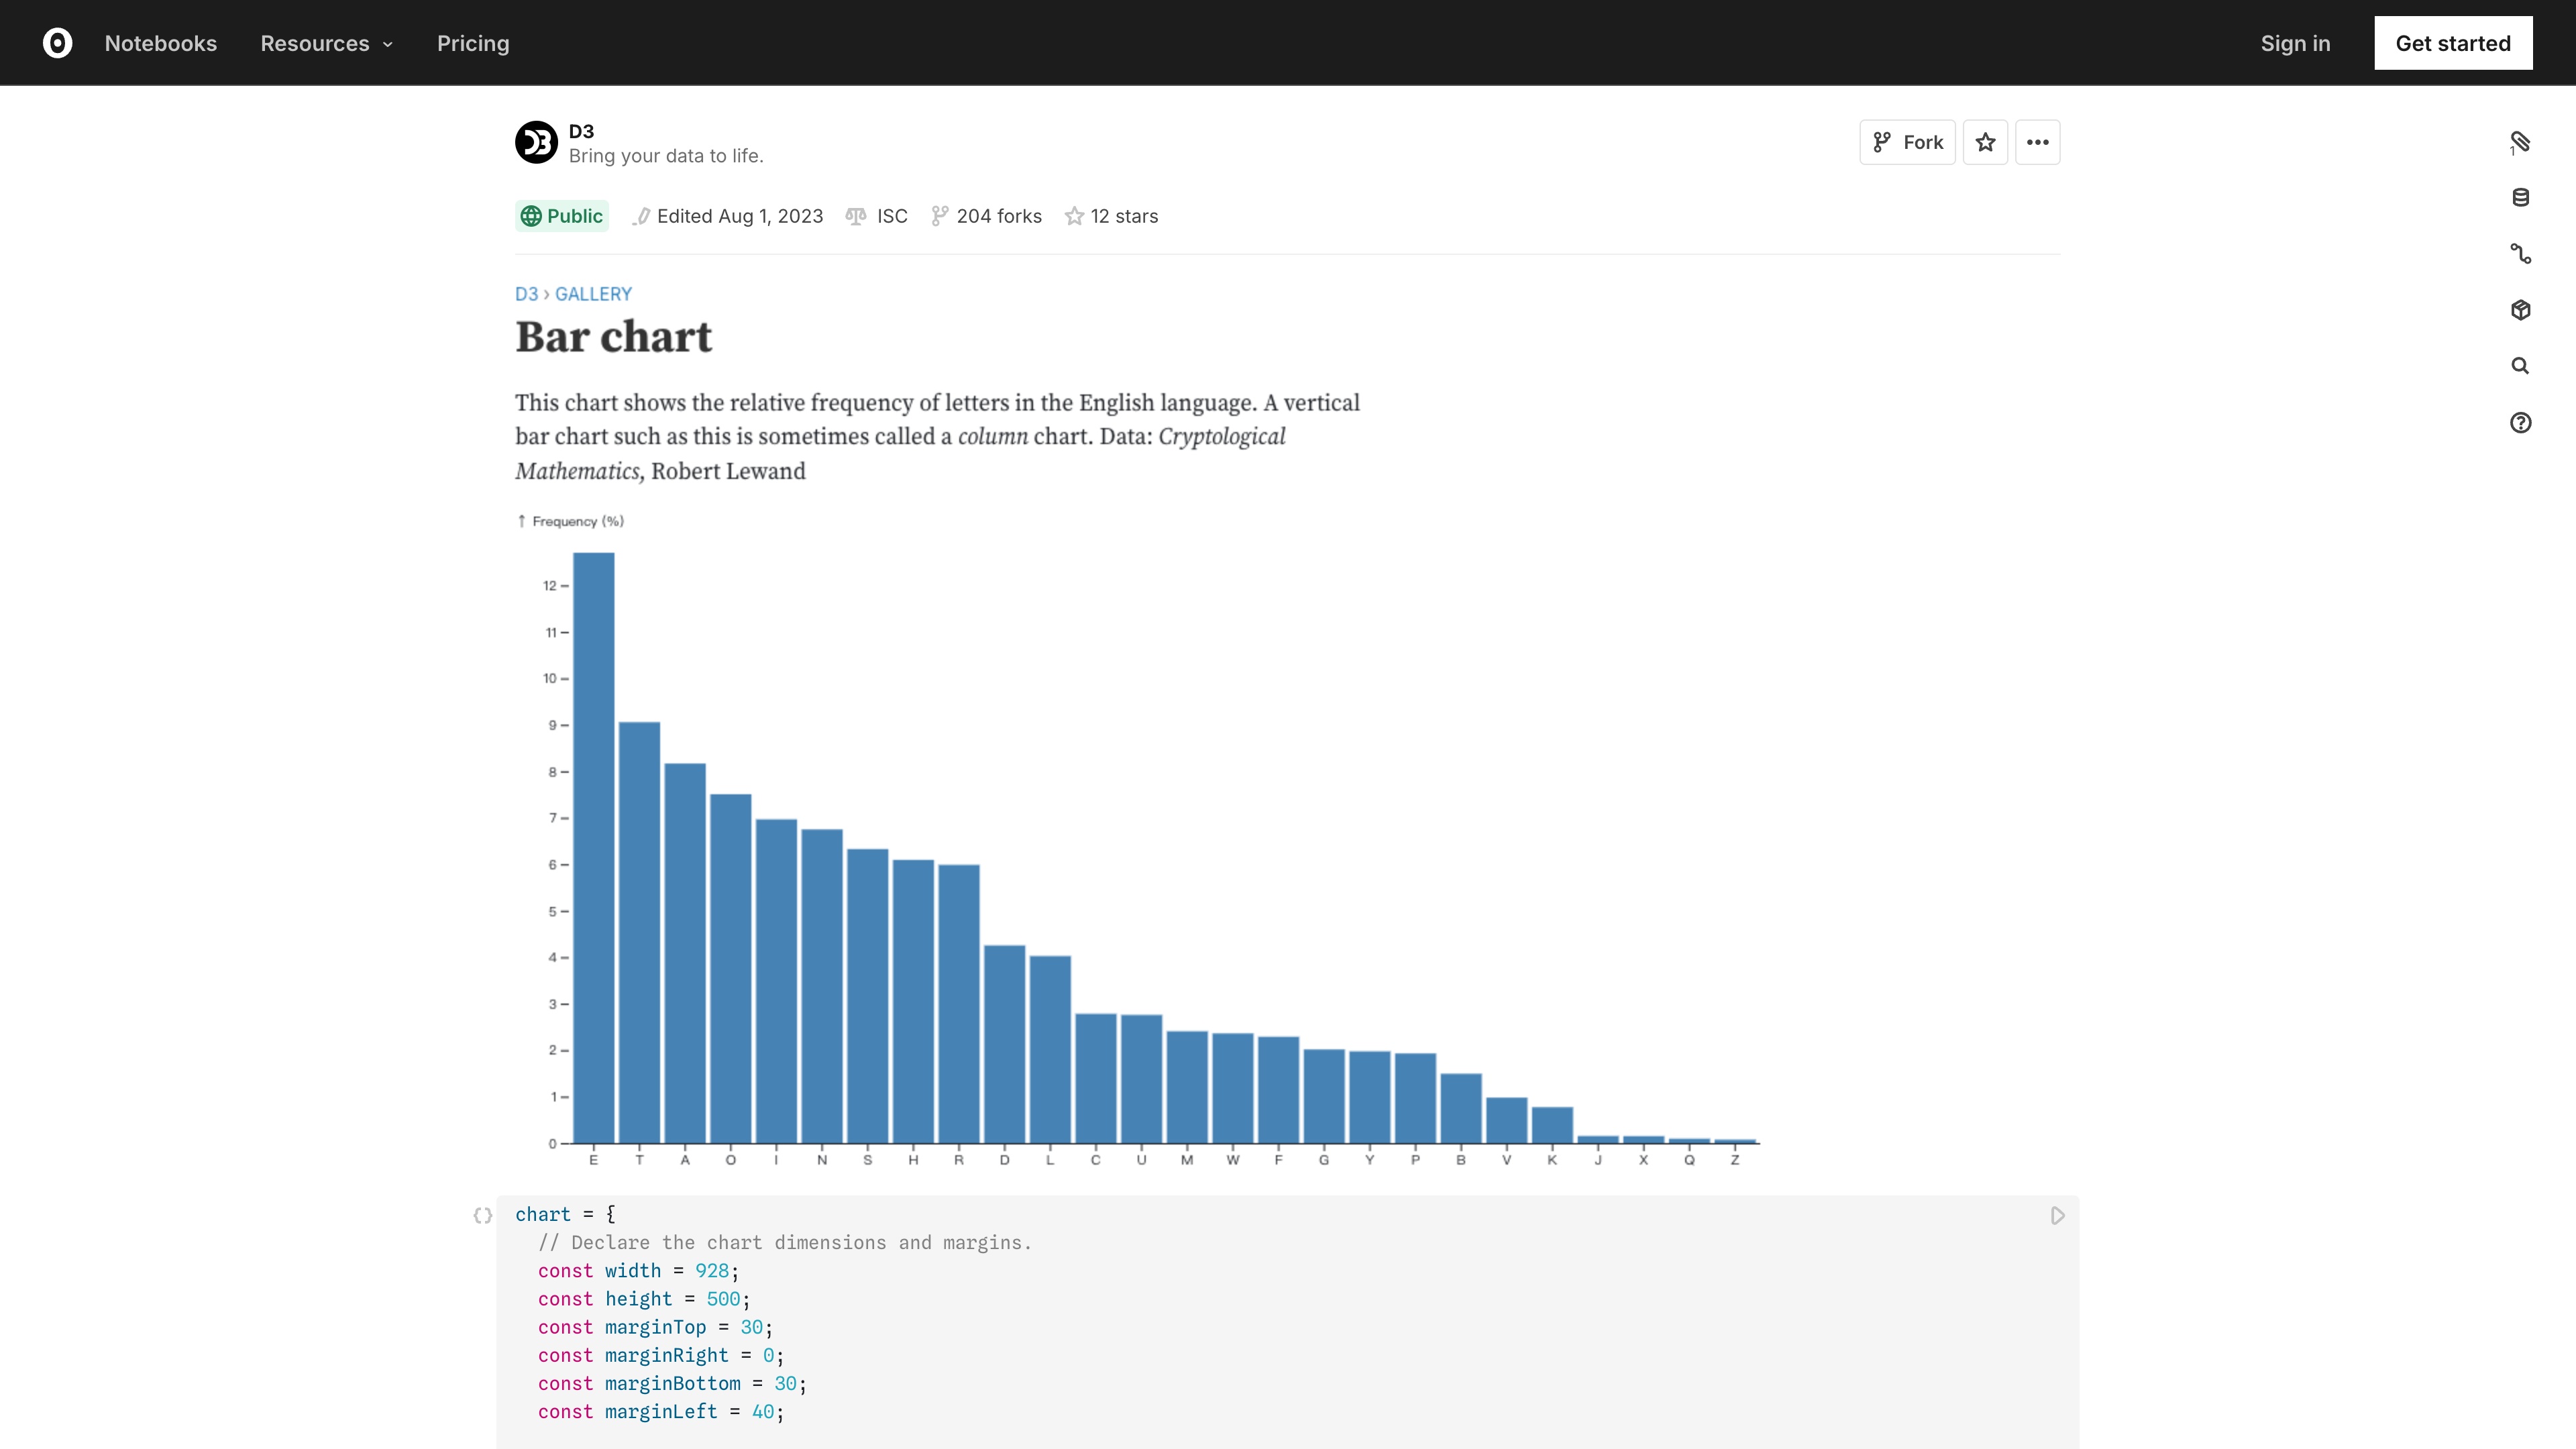
Above is a typical public notebook (the bar chart example from the official D3 gallery): prose, chart output, and code cells stacked in order, with the license (ISC), fork count, and star count shown in the header. Anyone can read public notebooks and tinker with their code without signing up.
One significant change comes with Notebooks 2.0: new notebooks use vanilla JavaScript (the original "Observable JavaScript" was a nonstandard dialect), adopt an open HTML-based file format, and can be compiled into static sites with the open-source Notebook Kit for self-hosting. However, per the company's forum post from June 2026, the new web editor still lacked some legacy features at that time — private imports, database clients, and the minimap among them — with more promised to follow. Users in the middle of this transition should watch for differences between the old and new generations.
The open-source toolchain: Framework, Plot, and D3
Observable's open-source projects work independently of the hosted platform, all under the ISC license:
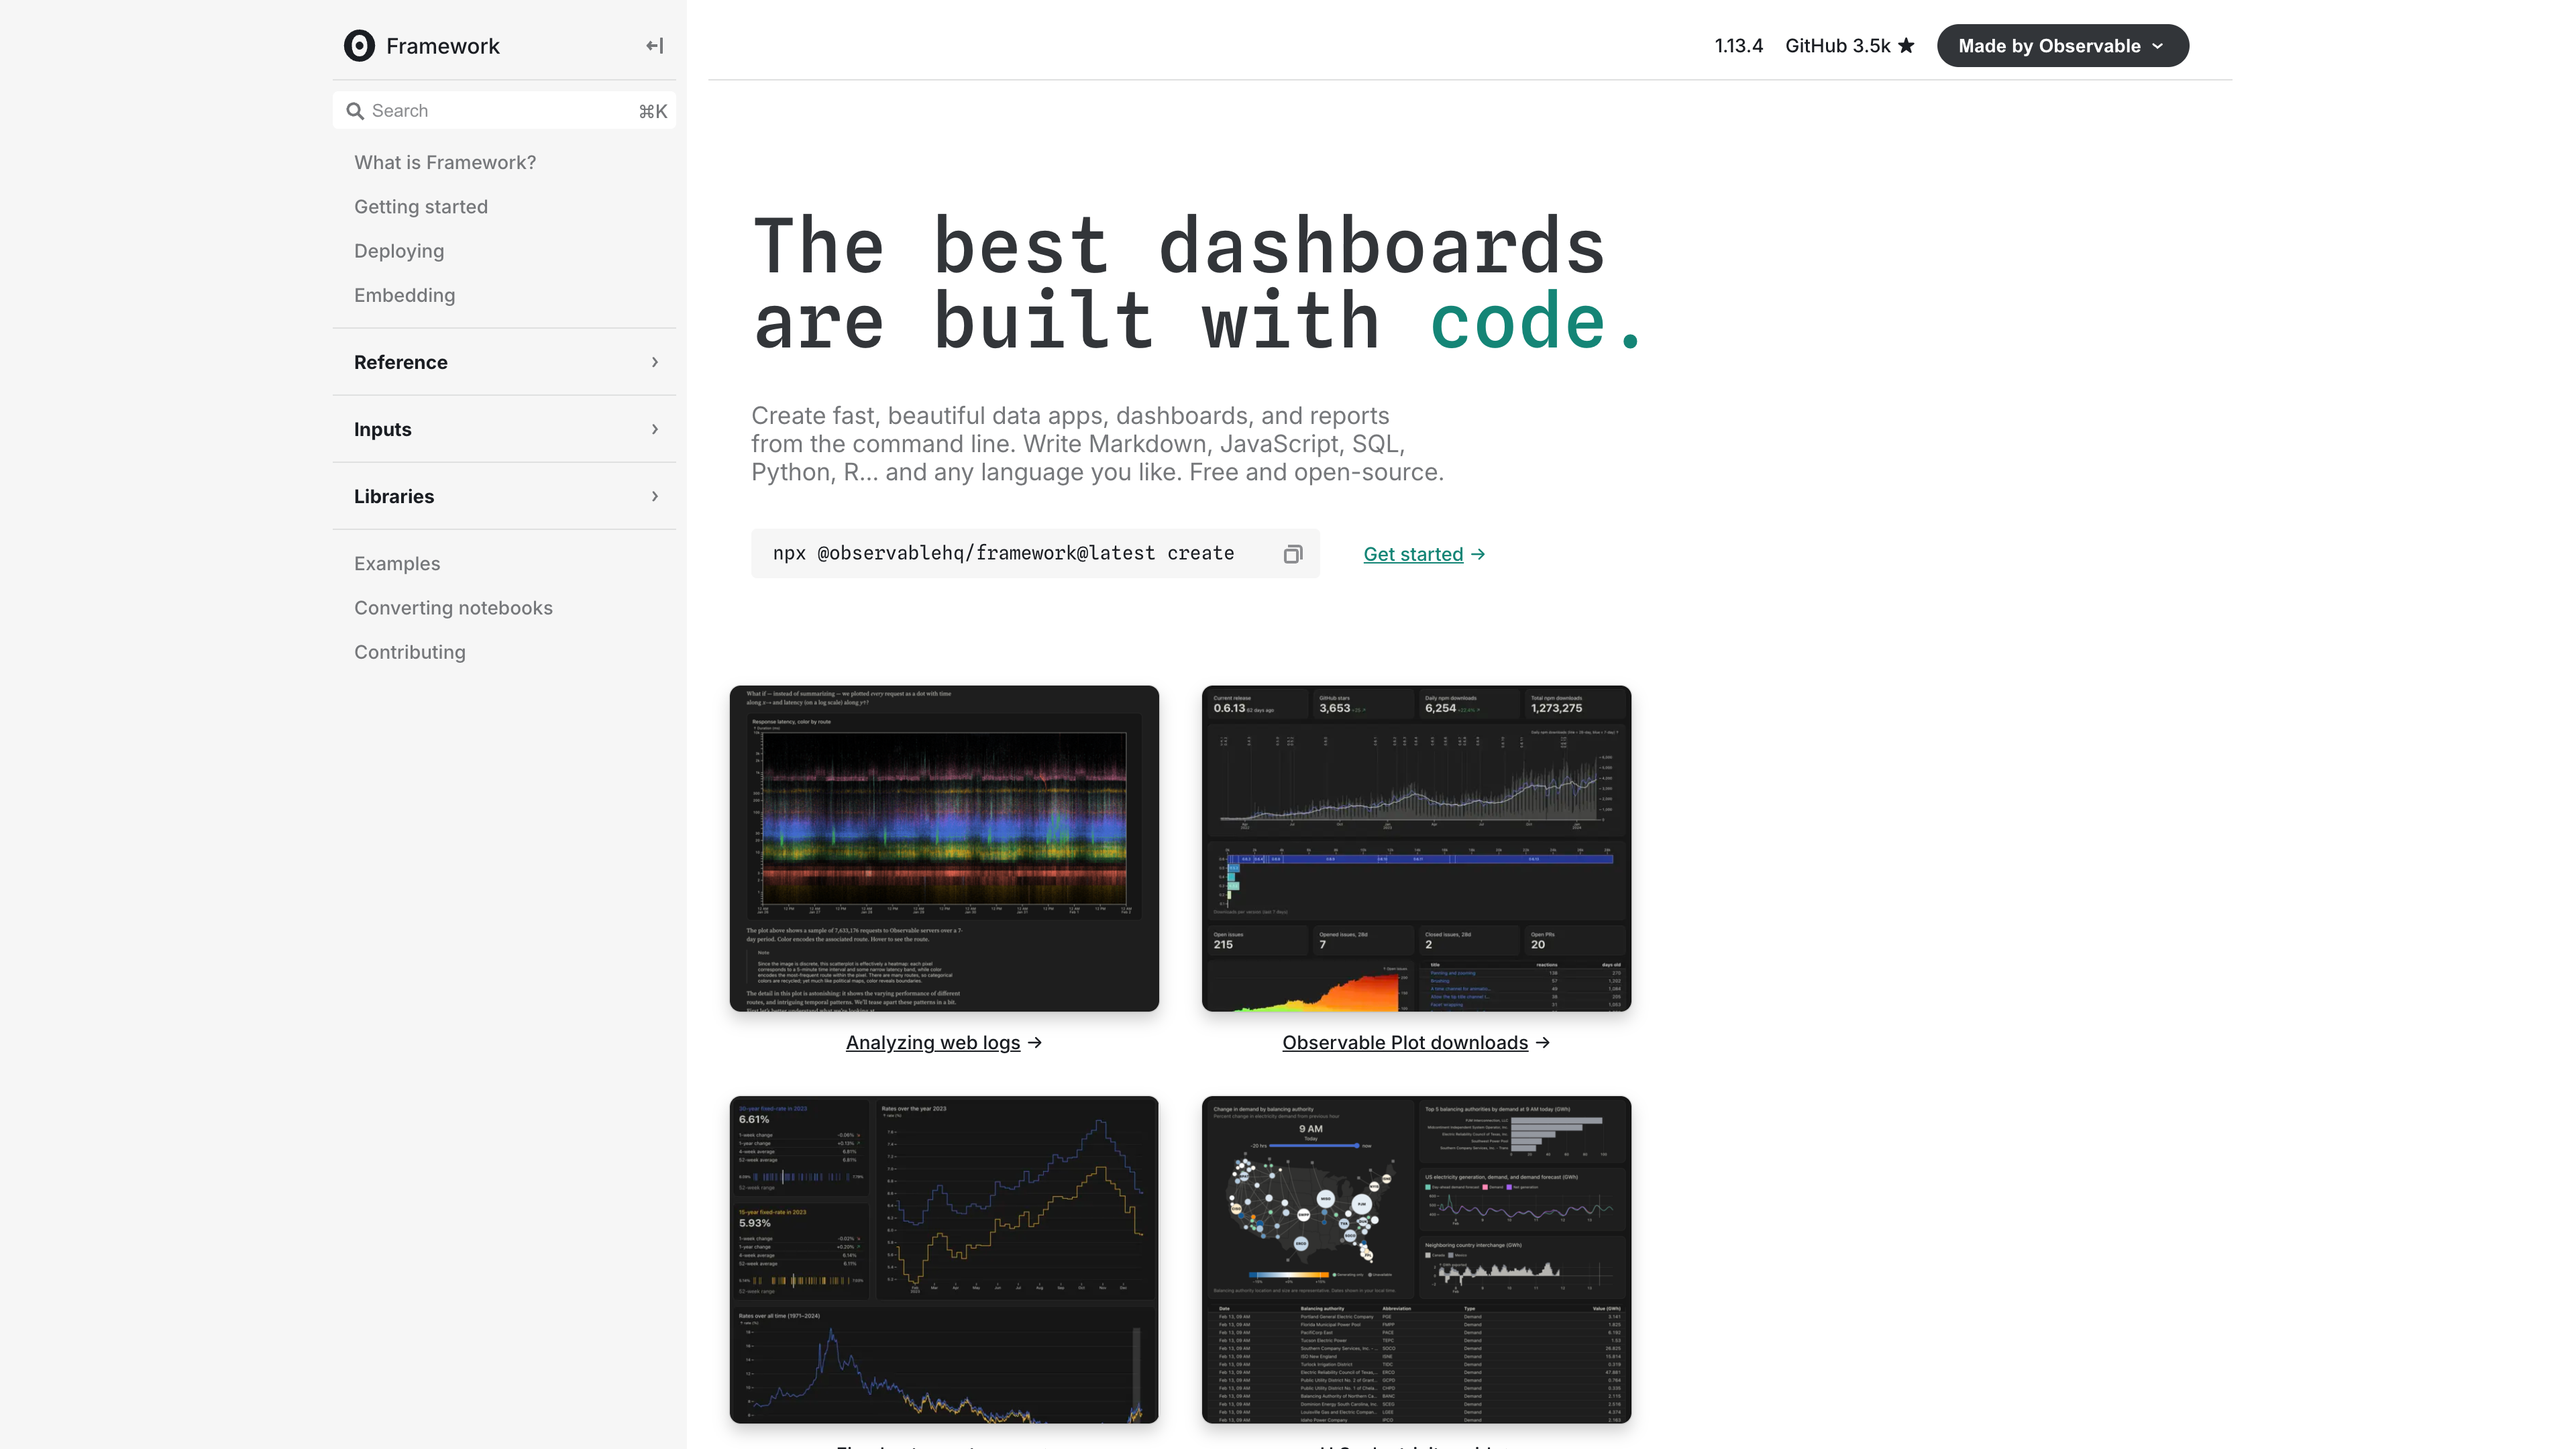
- Observable Framework: a static site generator for data apps, dashboards, and reports. Pages are written in Markdown, charts and interactions in reactive JavaScript, and data preparation (data loaders) in any language — Python, R, SQL, and more. Builds produce static sites you can deploy anywhere, fitting standard Git and CI/CD workflows. Released with "Observable 2.0" in February 2024, its GitHub repository has roughly 3.6k stars as of 2026-08-31 and remains actively maintained.
- Observable Plot: a JavaScript library for exploratory data visualization with a concise, declarative API implementing a layered grammar of graphics. Its GitHub repository has about 5.4k stars as of 2026-08-31.
- Notebook Kit: the open-source foundation of Notebooks 2.0 — a CLI and Vite plugin for building notebooks into static sites, open-sourced in June 2025 and actively iterated on.
- D3.js: the platform footer lists D3 among the projects Observable maintains, and the official D3 account keeps publishing example notebooks on the platform.
Observable is also developing Canvases, a two-dimensional infinite-canvas product aimed at BI-style analysis, which received a summer release in August 2025 adding advanced charts such as Sankey and bump charts. According to the company's forum reply in February 2026, Canvases is in limited availability and not currently accepting new users.
Copyright and content policy
Observable is a user-generated-content platform, and its Terms of Service (version effective April 15, 2025) spell out the content rules:
- Authors retain ownership of their content; Observable receives the hosting and display licenses needed to operate the service.
- Publishing a public notebook grants every Observable user the right to view, import, and fork it — others can load or copy your published content into notebooks they control. This matches the platform's code-reuse culture, but it means public notebooks are the wrong place for code or data you don't want reused.
- Authors can attach a license to a notebook (shown in the header of public notebooks, e.g. ISC or MIT) to clarify reuse terms beyond the platform.
- The terms explicitly prohibit uploading personally identifiable information (PII) into notebooks. Private notebook content is treated as confidential; employees may access it only in limited circumstances such as support, maintenance, and security.
- Copyright complaints follow a DMCA process via support@observablehq.com.
Where it fits
- Data journalism and interactive storytelling: with its New York Times visualization lineage, Observable is well suited to interactive, embeddable chart-driven stories;
- Learning data visualization, D3, and JavaScript: a million-plus public notebooks are there to fork and remix, and the official templates plus the D3 gallery form a structured curriculum;
- Team data exploration and prototyping: real-time collaboration, version history, and comments suit mixed analyst-engineer teams validating ideas quickly;
- Production dashboards and reports: Framework projects live locally, work with Git and CI/CD, and self-host anywhere — no dependence on the hosted platform;
- Technical writing and teaching: weave code, math, charts, and prose into runnable documents you can also embed in your own site.
Limitations
- JavaScript-centric. The visualization and interaction layer of notebooks is JavaScript; Framework's data loaders accept Python, R, and others, but the front end remains JS. The learning and migration cost for Python-ecosystem users is real.
- Collaboration is paid. Real-time multiplayer editing, scheduled runs, watermark removal on embeds, and guest/access controls all require Pro ($22/month per editor as of 2026-08-31). The free tier is essentially personal public/private notebooks.
- The platform is mid-transition. Notebooks 2.0 only just arrived on the web; old and new notebook formats, editors, and docs coexist, and some legacy features have yet to be ported. Following along requires patience.
- Desktop is macOS-only (macOS 15+ on Apple Silicon). Windows and Linux users rely on the web app or a text editor plus Notebook Kit.
- Public content is forkable and importable by default. Great for reuse, risky for IP-sensitive work — think before publishing, use private notebooks (available on the free tier), or attach a clear license.
- English-only interface, with no official localization.
Alternatives worth knowing
- Jupyter: a notebook ecosystem centered on Python and other kernels, executing code locally or on a server rather than in the browser; strong for scientific computing, but interactive visualization and web sharing need extra tooling.
- Quarto: an open-source technical publishing system built on Pandoc that renders multi-language code blocks to static documents — good for reports and books. Interactivity comes from Observable JS (it natively supports Observable's ojs cells) or Shiny.
- CodePen: a front-end snippet community focused on UI experiments, without data workflows, database connections, or document-style narrative.
Sources
- Observable homepage, About, Pricing, Terms of Service, Notebooks documentation (all checked 2026-08-31)
- Simon Willison: Observable Beta (2018-01-31)
- Business Wire: $10.5M Series A (2020-11-20), $35.6M Series B (2022-01-13)
- Observable Forum: Announcing Observable 2.0 (2024-02-15), Previewing Observable Notebooks 2.0 (2025-07-29), Try the new Observable today (2026-06)
- Observable Framework and GitHub repos observablehq/framework, observablehq/plot, observablehq/notebook-kit (star counts verified via the GitHub API on 2026-08-31)