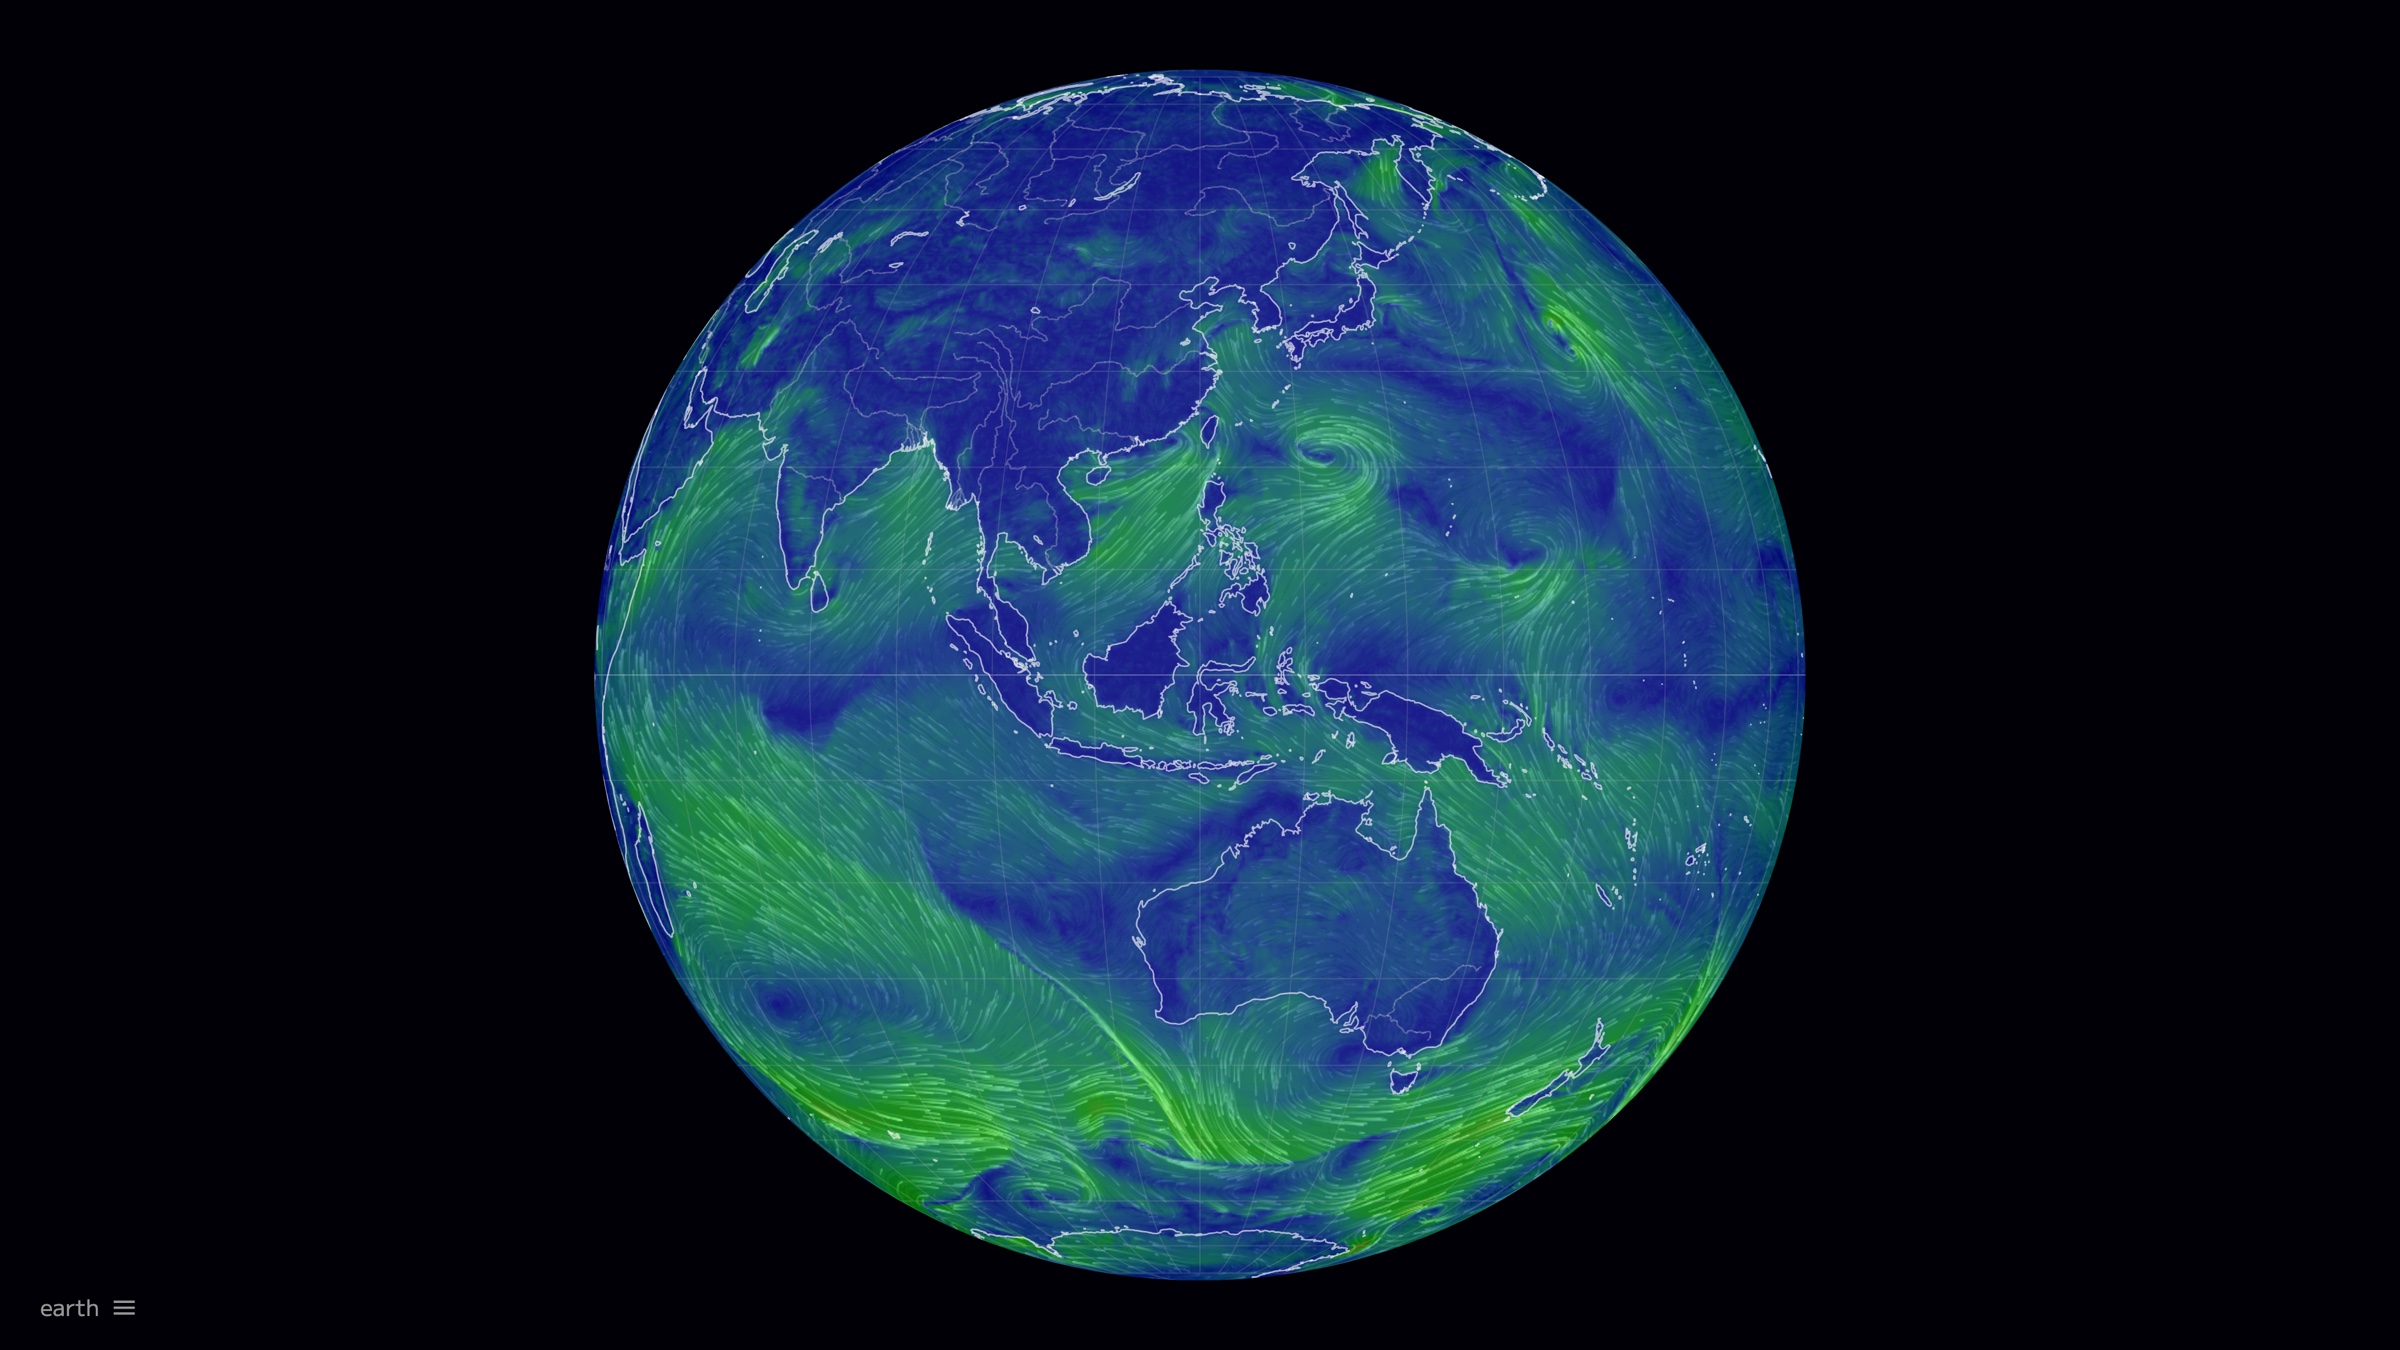
earth (earth.nullschool.net) is a free, no-signup map of global weather and ocean conditions. It renders the output of numerical forecast models as a globe you can drag, spin and zoom: wind from the surface up to the stratosphere flows as animated particles, while temperature, pressure, humidity and precipitation appear as color overlays, and further layers cover ocean currents, waves, sea surface temperature, aerosols and the aurora. The site was created in 2013 by Cameron Beccario, a software engineer based in Tokyo, and is now run by the company he founded, Nullschool Technologies. Compared with commercial weather platforms, its verifiable distinctions are these: atmospheric and ocean motion is drawn as an intuitive flow field, the interface names the data source behind every layer, and a free version of the source code is public on GitHub under the MIT license.
Site overview
- URL: https://earth.nullschool.net/
- Type: visualization of global numerical weather and ocean forecast data
- Cost: free; no third-party ads were observed, though a small banner promotes the site's own mobile app (dismissible) and the page loads Google Analytics
- Account requirements: none
- Interface languages: English, 简体中文, 繁體中文, 日本語, 한국어, Русский, Español, Français, Português, हिन्दी, Čeština, translated by community volunteers
- Data updates: the official About page states that weather data is updated every three hours, ocean currents and sea surface temperature daily, waves every three hours, and the aurora every thirty minutes (About, as of 2026-08-31)
Background
According to the company page, earth began in 2013 as "a personal challenge to learn HTML, CSS and Javascript". The idea was inspired by the HINT.FM wind map, and the first prototype visualized air quality over Tokyo at air.nullschool.net (About). The global version launched in December 2013 and was picked up by Slate and The Bridge within weeks. The companion repository cambecc/earth was created on 2013-11-04 (GitHub API, checked 2026-08-31).
The company page describes the site as serving "millions of visitors" and credits it in textbooks, scientific journals, museum exhibits and newscasts; its gallery includes uses in Nature Climate Change (2015), BBC News (2017) and a US National Academies publication (2016). The About page also notes that the site was selected for the CLEAN (Climate Literacy and Energy Awareness Network) collection of educational resources. In February 2025 the author incorporated Nullschool Technologies in Tokyo, turning the hobby project into a business whose scope includes licensing data visualizations (company profile).
Layers and data sources
The site organizes its data into six modes, each with its own animation type, height levels and overlays. The menu always names the dataset and source behind the current layer:
Air. The wind particle animation comes from NOAA's GFS model (the interface shows "Wind @ Surface / GFS / NCEP / US National Weather Service"). Overlays include temperature, relative humidity, dew point, wet bulb temperature, 3-hour precipitation accumulation, CAPE, total precipitable water, total cloud water, mean sea level pressure, a "misery index", the UV index and instantaneous wind power density. Height levels run from the surface (Sfc) up to 10 hPa (about 26,500 m), with the 250 hPa level commonly used for watching the jet stream.
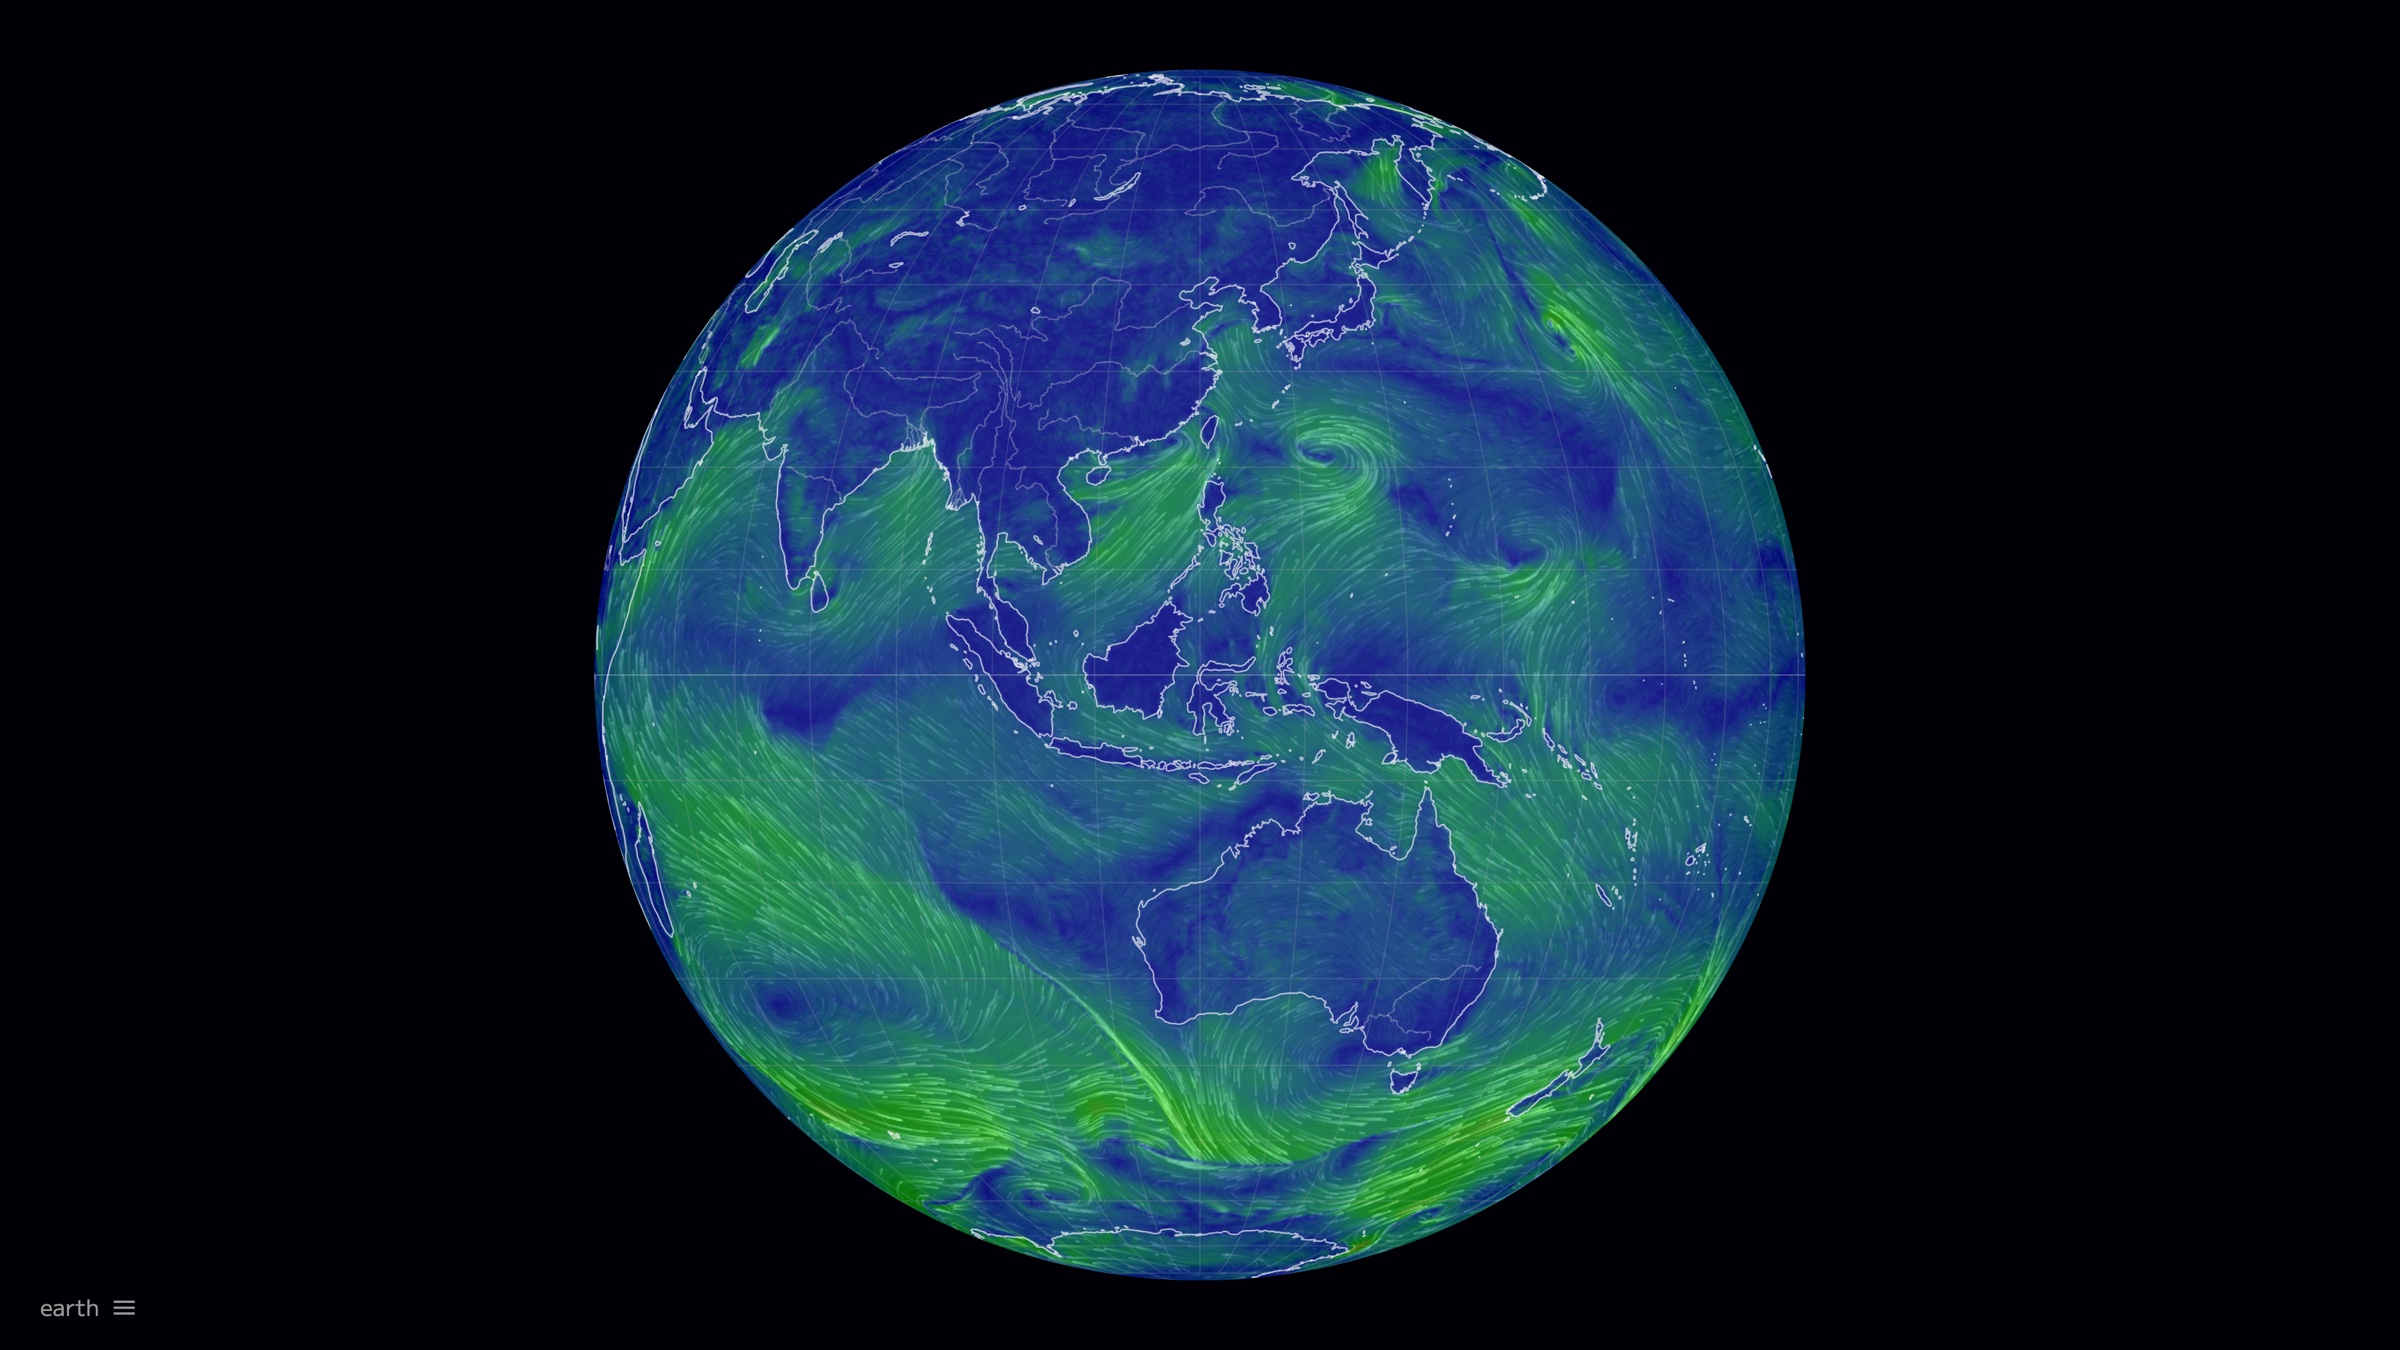
Ocean. The current animation and sea surface temperature come from the Copernicus Marine Service's Global Ocean Physics Analysis and Forecast and the OSCAR ocean current reanalysis (the interface shows "Ocean Currents @ 5 m below Surface"); waves come from WAVEWATCH III, alongside sea temperature anomaly (SSTA) and coral bleaching alerts (BAA) from NOAA Coral Reef Watch.
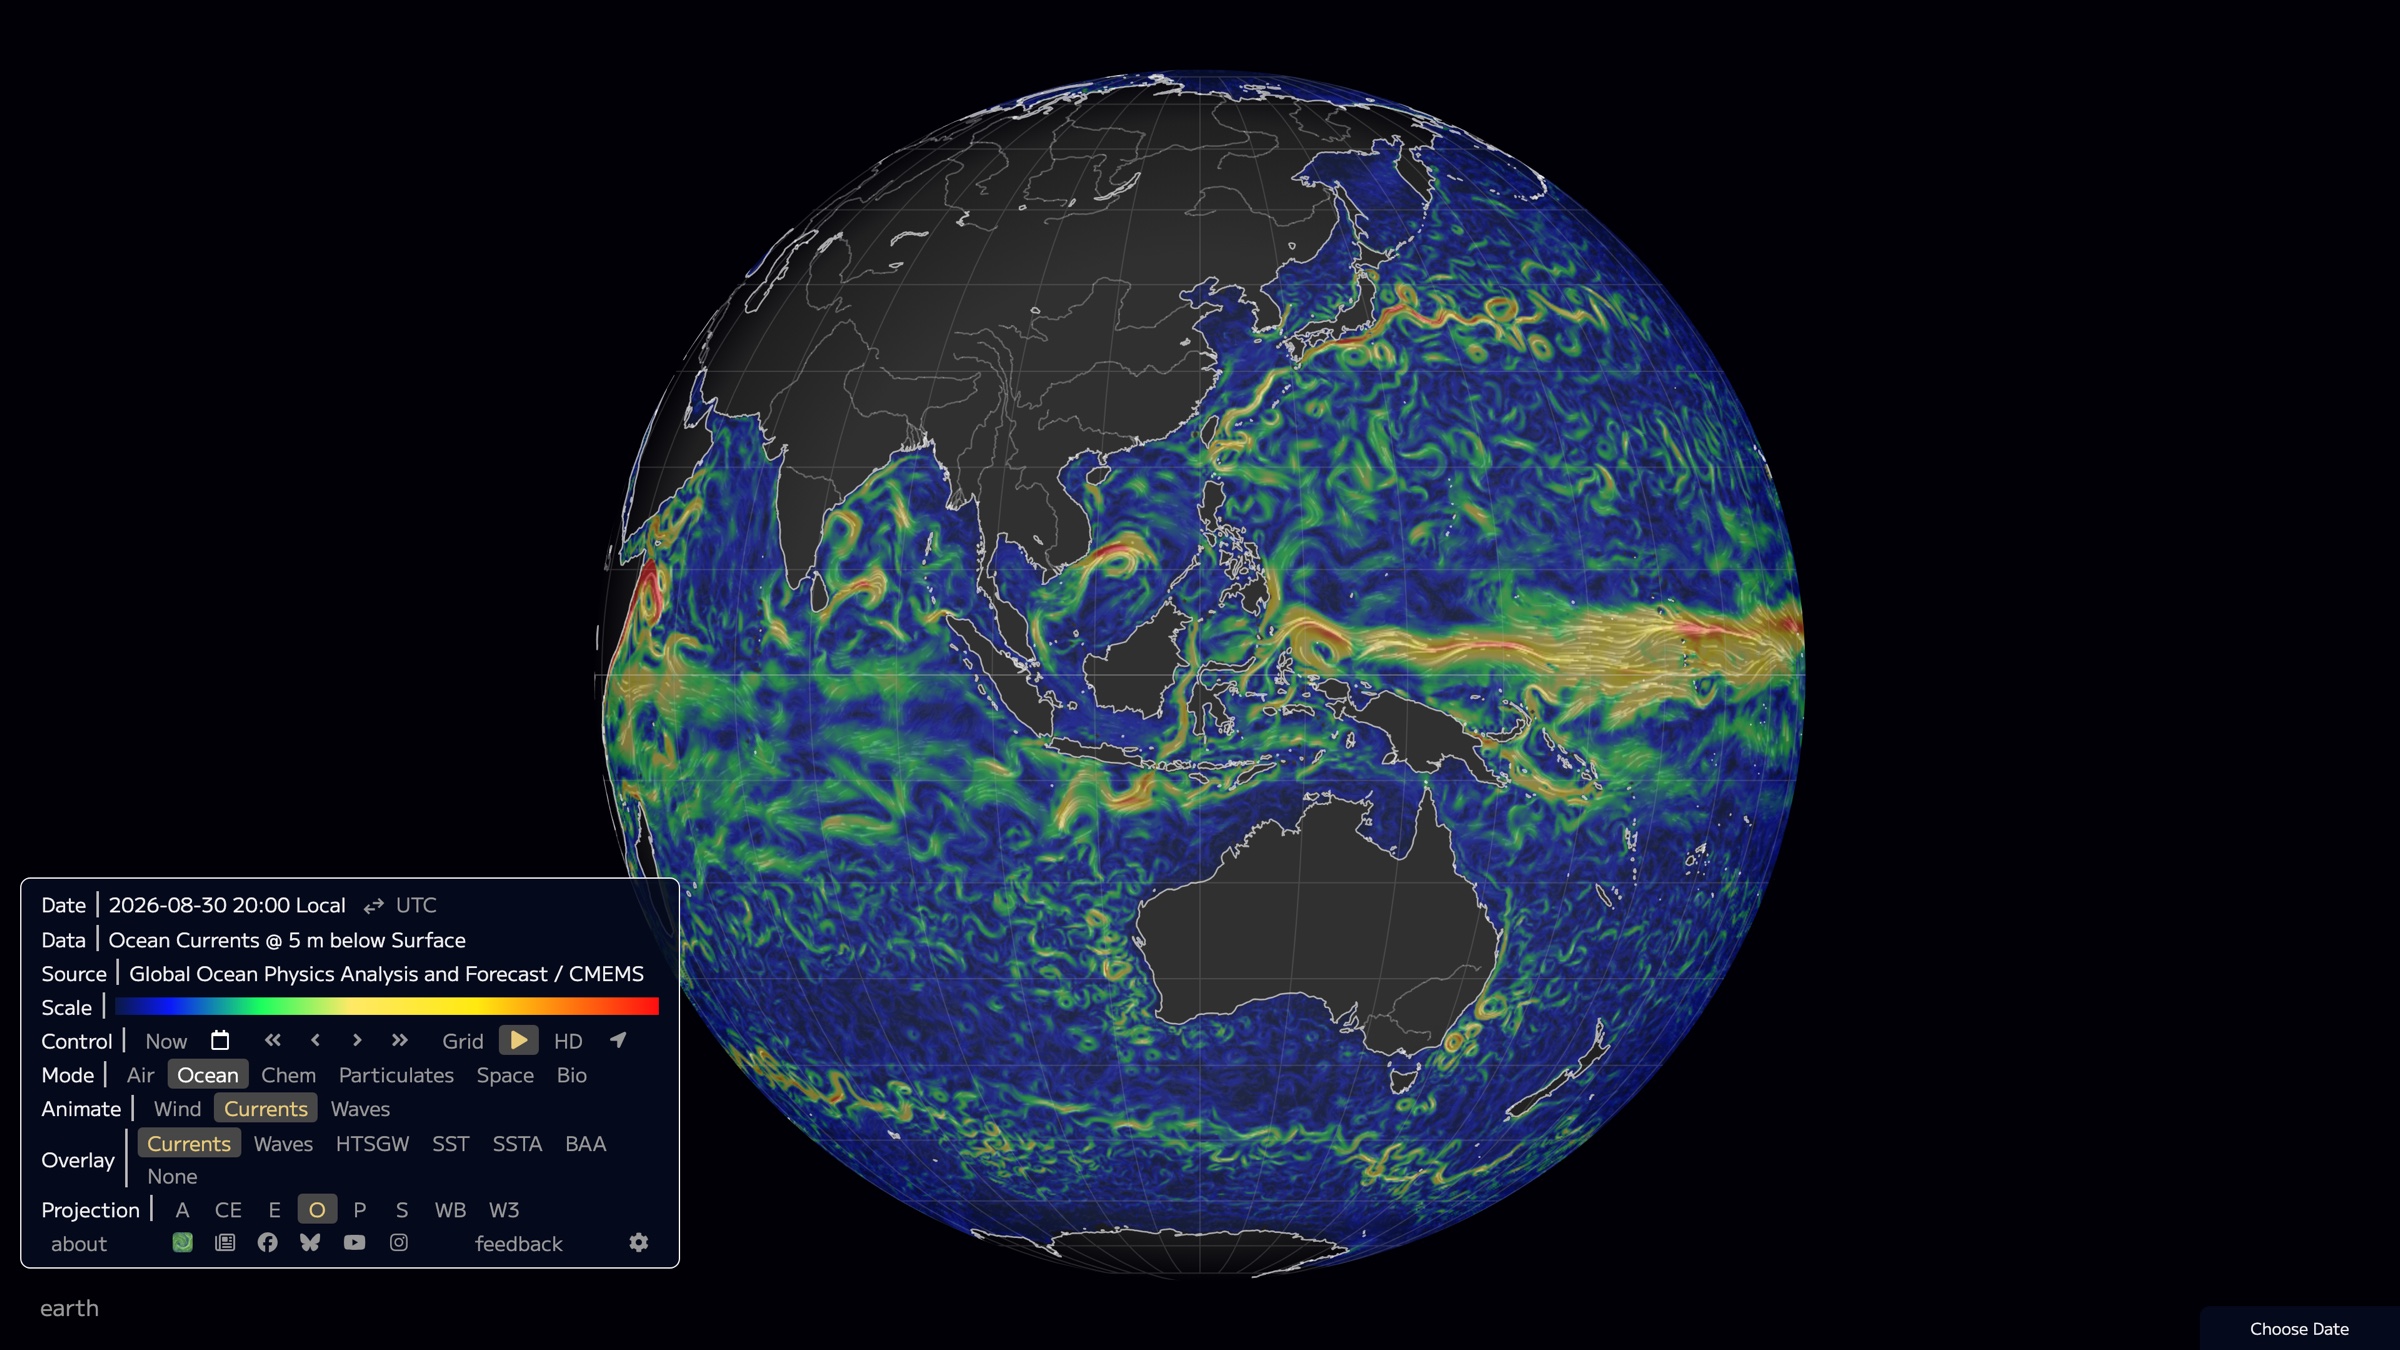
Chem and Particulates. Gas concentrations — carbon monoxide, carbon dioxide, sulfur dioxide, nitrogen dioxide — come from NASA's GEOS-5 assimilation system, while dust, sulfate, organic matter and PM1/PM2.5/PM10 overlays also draw on the CAMS atmosphere monitoring service.
Space. The probability of visible aurora, from NOAA's Space Weather Prediction Center OVATION model, updated every thirty minutes per the About page.
Bio. Coral bleaching heat stress and active fire detections from NASA FIRMS (near-real-time VIIRS satellite products).
The About page is explicit about update cadence: weather every three hours, ocean currents and sea surface temperature daily, waves every three hours, aurora every thirty minutes. All of it is public data produced by government agencies and research labs; the site itself generates no data.
Interaction and views
The map supports drag-to-rotate and scroll-to-zoom, from a whole-globe view down to city and coastline level with place labels. The "earth" button in the bottom-left corner, or the e key, opens the control menu, which concentrates every function: mode switching, animation type (wind, currents, waves), height level, overlay, projection and time controls.
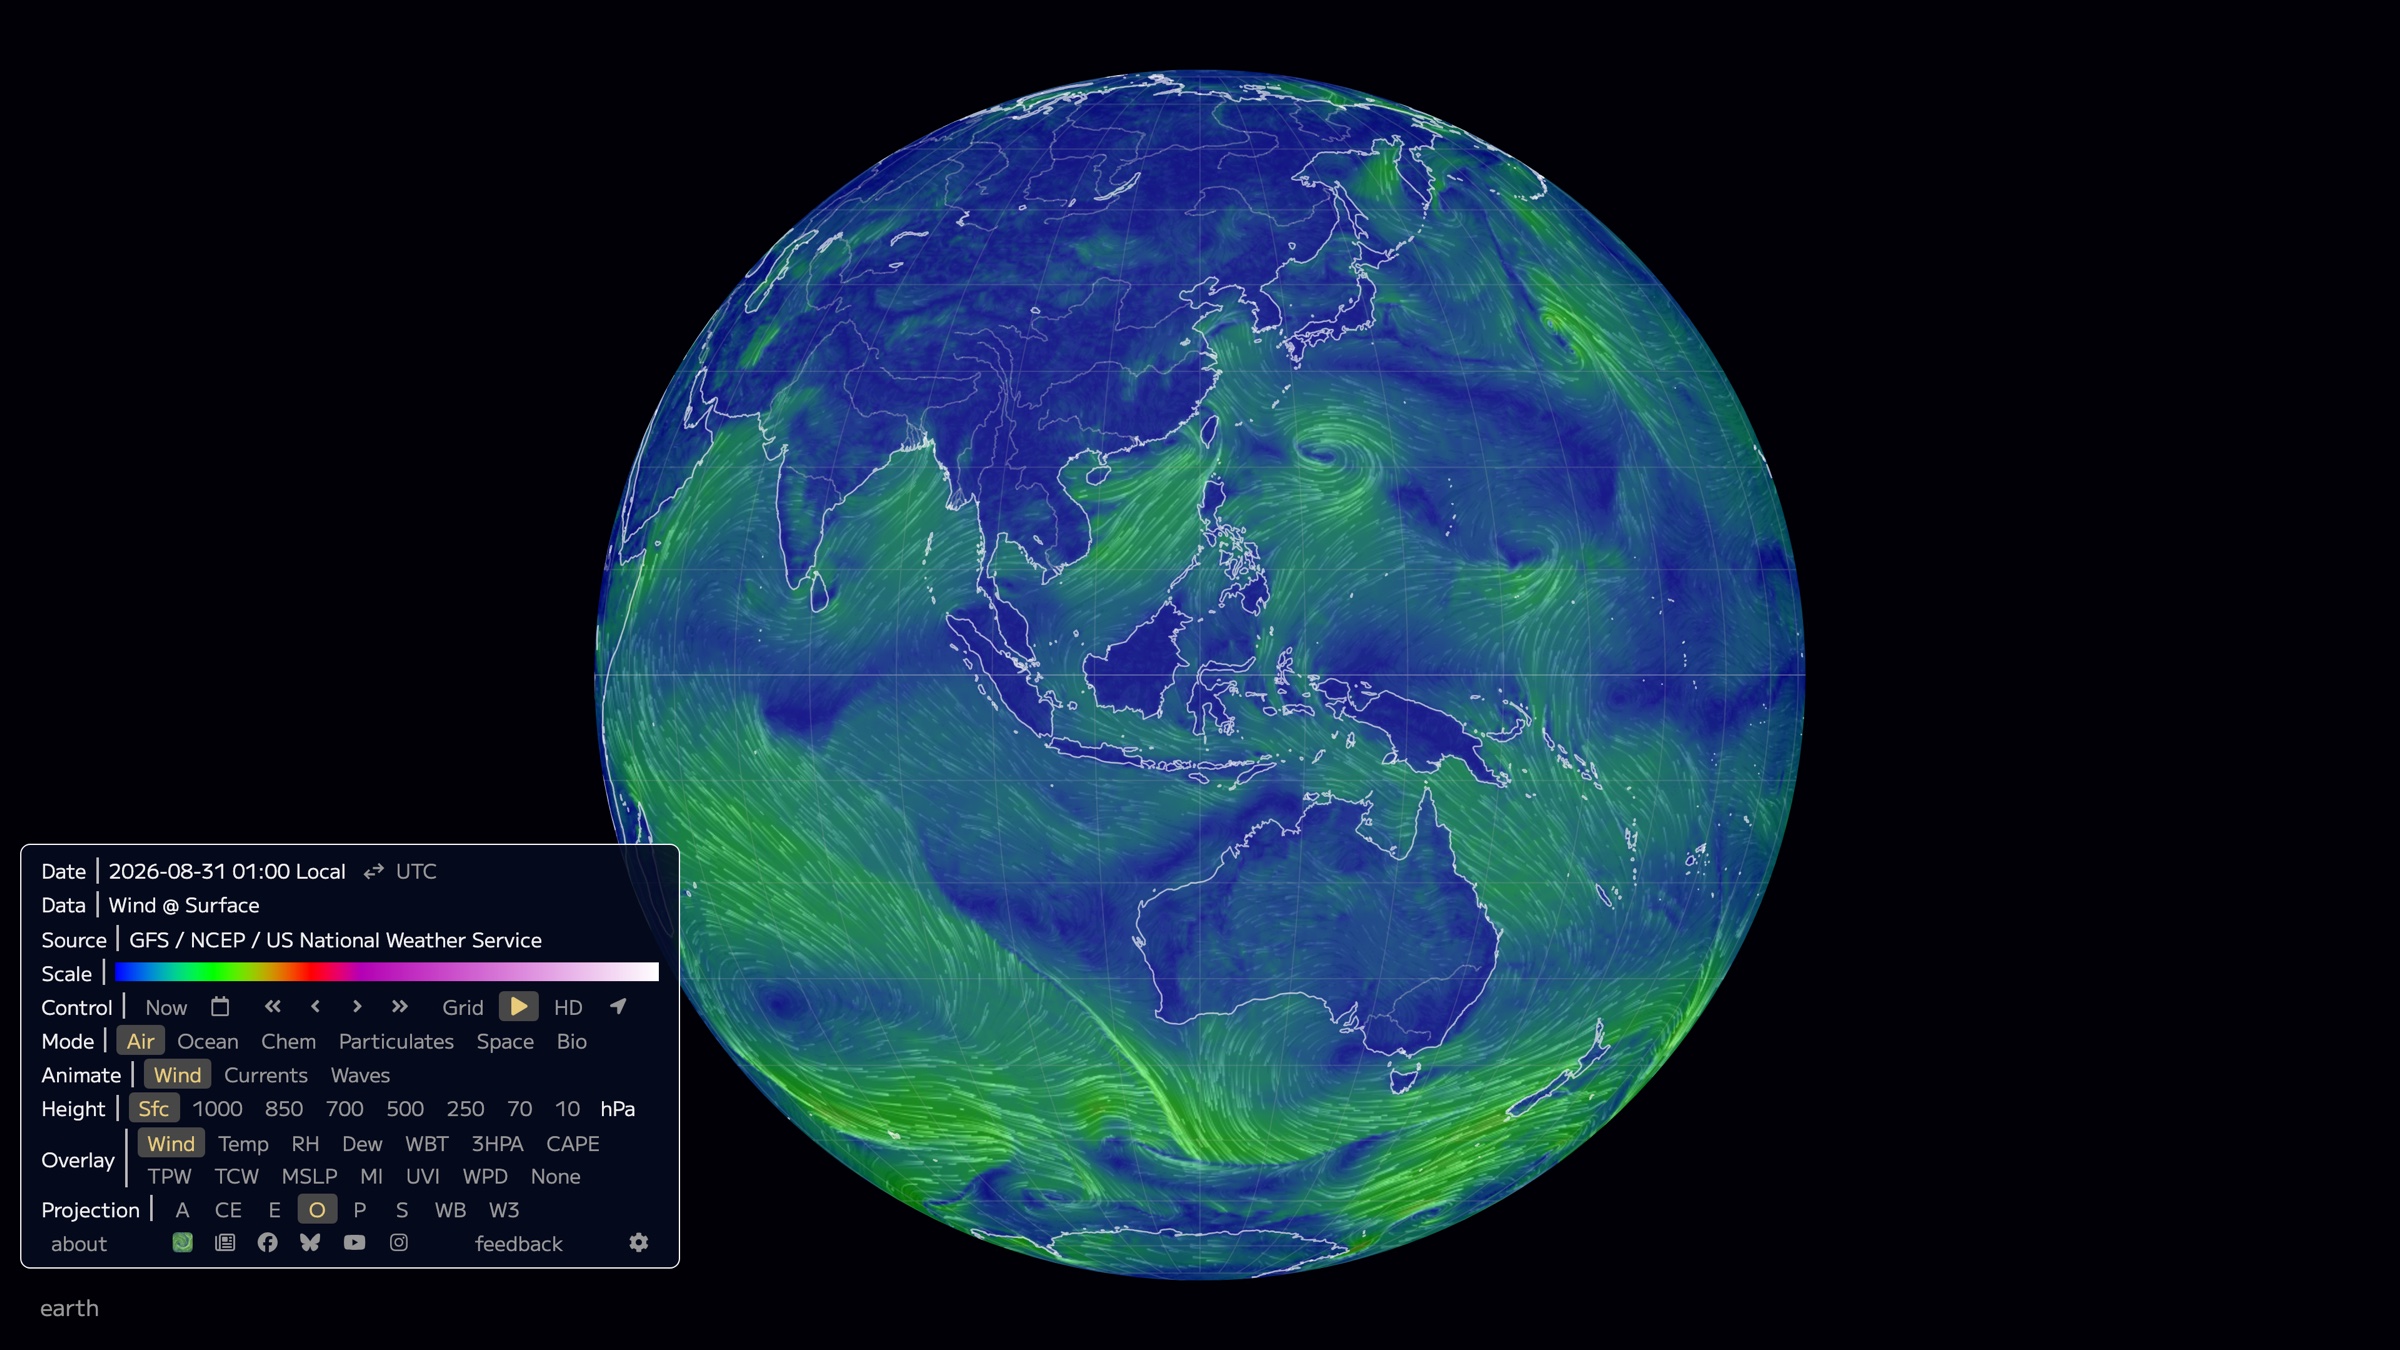
"Now" returns to the most recent model output; time can be stepped by ±1 or ±8 hours or picked from a calendar. During verification, stepping forward from 2026-08-30 17:00 UTC ran to 2026-09-14 17:00 UTC — roughly fifteen days of forecast horizon. The full view state (mode, layer, projection, center, zoom, time) is written into the URL fragment (for example #current/wind/surface/level/orthographic=...), so any specific view can be shared or bookmarked. Eight projections are available, including orthographic, equirectangular, conic equidistant, Patterson, stereographic, Waterman butterfly, Winkel Tripel and Atlantis. There is also a grid toggle, a high-definition rendering toggle and a full set of keyboard shortcuts listed on the About page.
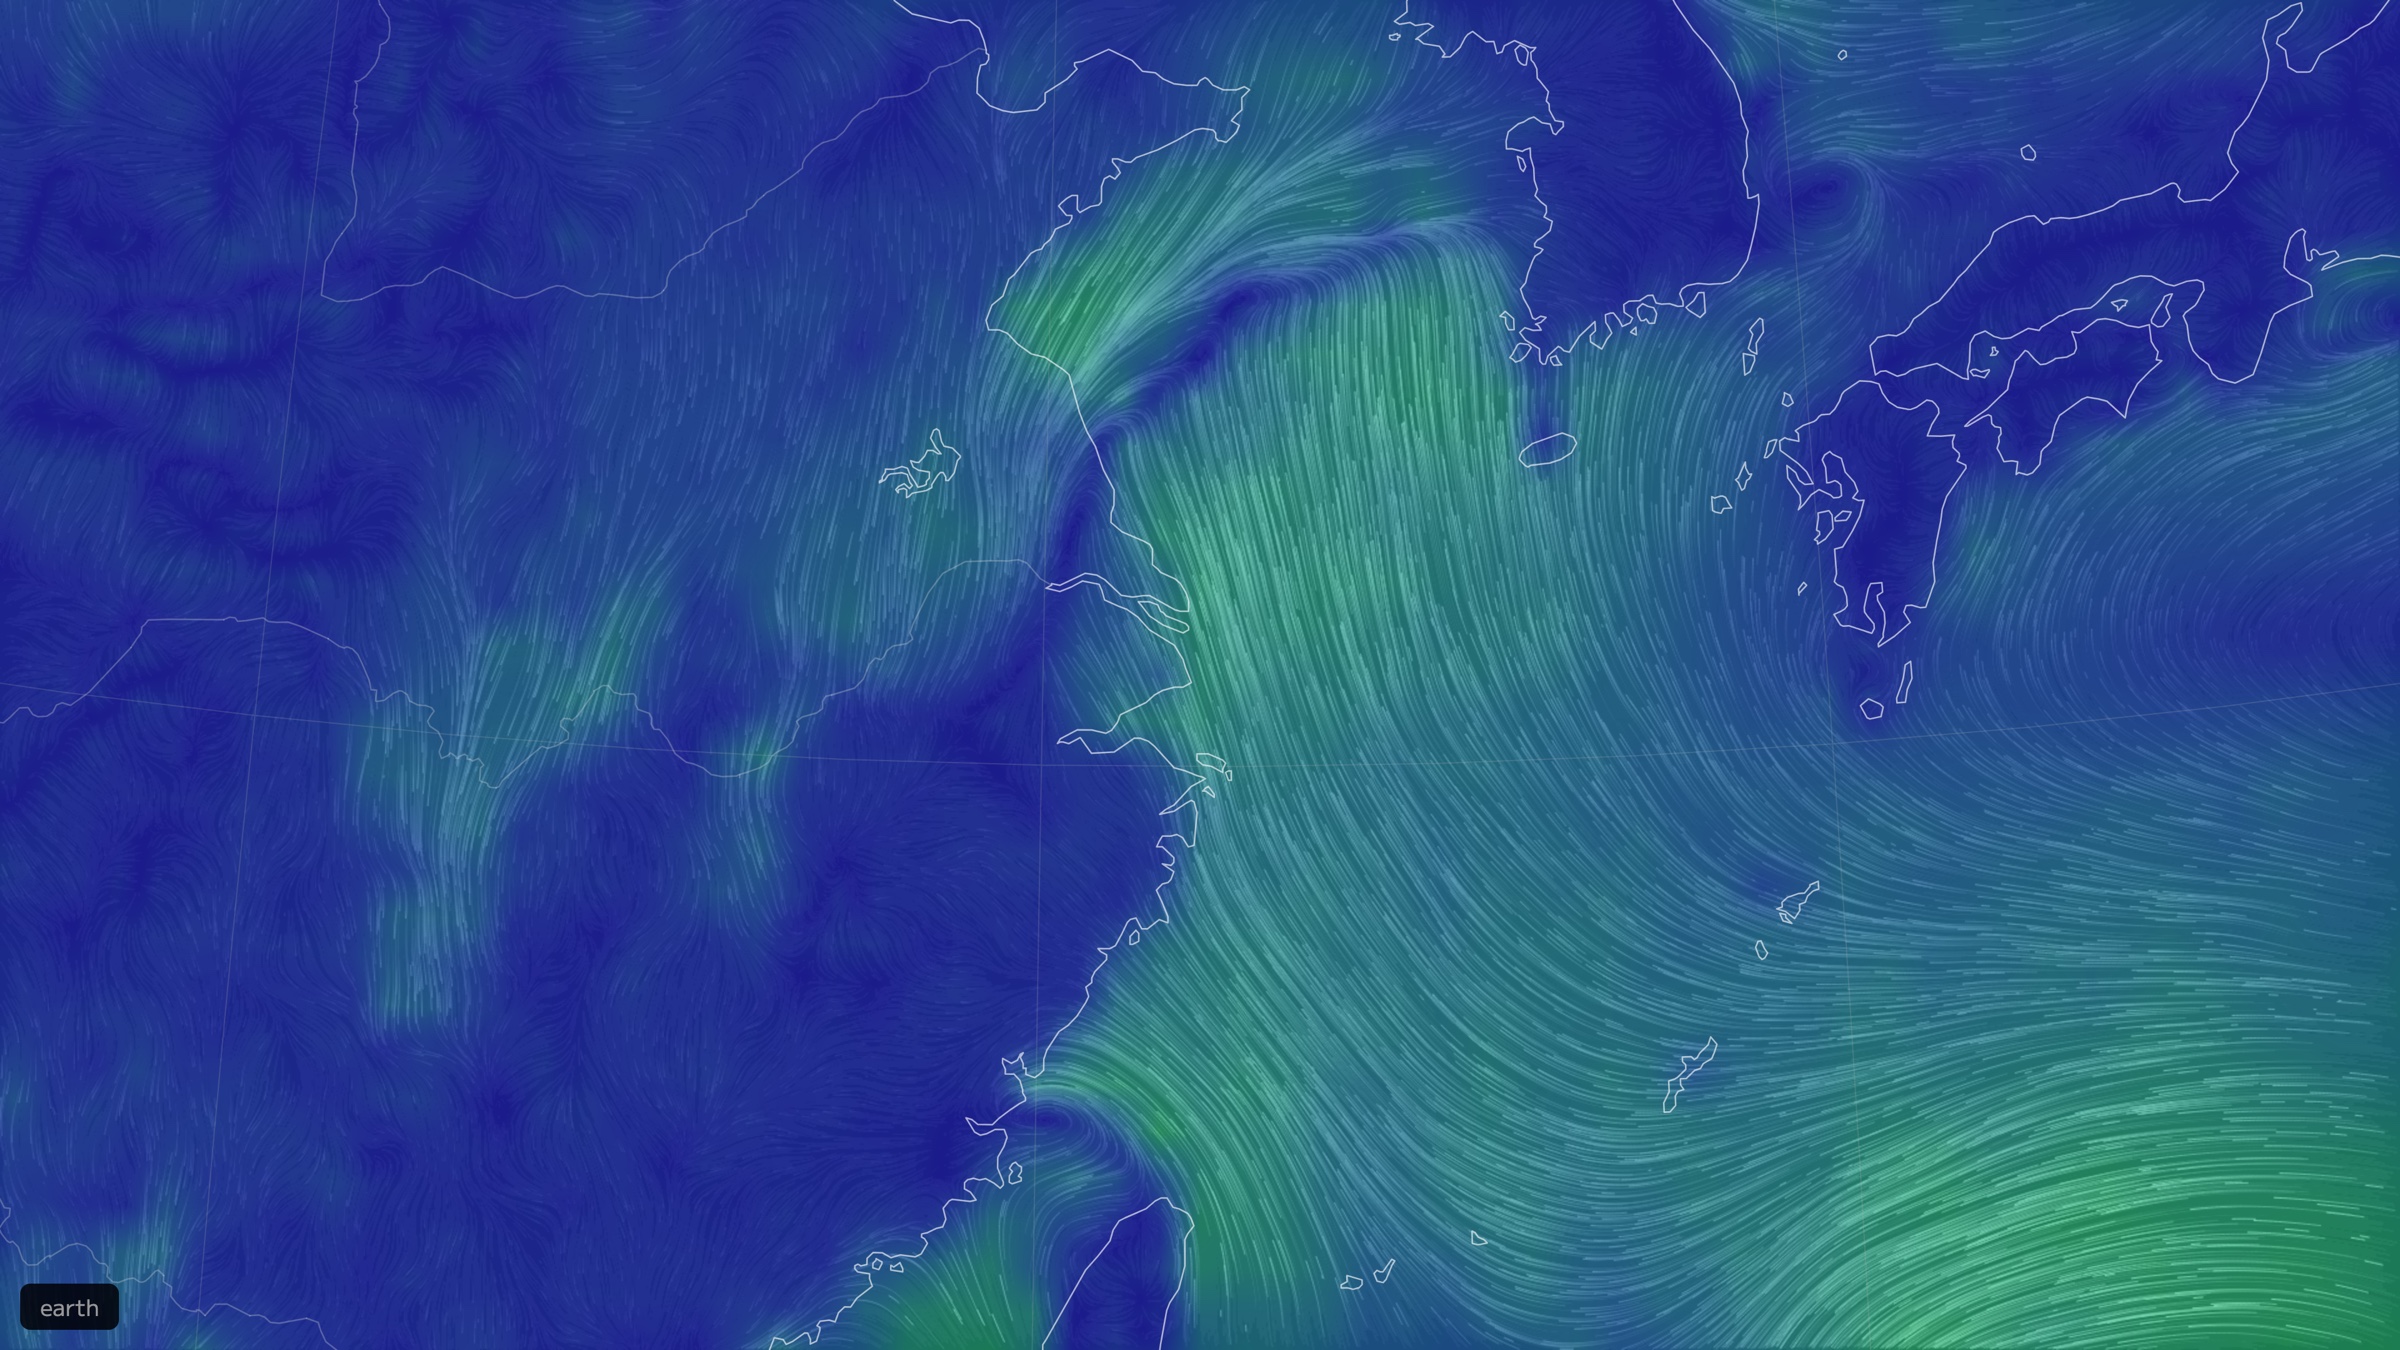
The interface is available in eleven languages; Simplified Chinese and Traditional Chinese live on dedicated paths, translated by volunteers — the About page credits more than two hundred of them. The menu also links to the official mobile app and a newsletter.
The open-source version
The About page notes that "a free version of the source" is published at cambecc/earth on GitHub under the MIT license. As of 2026-08-31 the repository has about 6.6k stars and 1.2k forks, but its most recent push dates from October 2022 (GitHub API); features added to the live site since then, such as the Bio mode, are not in that repository, so the two have diverged. On the technical side, the About page credits the D3 projection and visualization library, Natural Earth geographic data, the netcdf-java GRIB/NetCDF decoder, and hosting on Cloudflare, Amazon S3, Backblaze B2 and DigitalOcean.
What the data actually is
Everything earth displays is output from numerical models or analysis products — not live observations. The About page's disclaimer reads: "weather and ocean data are generated from numerical models; Nullschool Technologies Inc. implies no guarantee of accuracy". Layer by layer: GEOS-5 chemistry and particulates carry the provider's "experimental … for research purposes only" disclaimer; OI SST sea temperatures are preliminary for two weeks and may change; and the author has documented that before 2017-01-24 the carbon dioxide layer carried a uniform +32 ppmv offset to bring GEOS-5 closer to observed values — a correction he describes as "not scientifically valid". The About page's data notes also explain the physical meaning of each overlay (significant wave height, aerosol optical thickness, the approximate altitudes of the pressure levels); it is worth reading before treating the site as anything more than an illustrative view.
Use cases
- Building intuition for large-scale atmospheric and ocean motion — jet streams, cyclones, monsoons and gyres — far more quickly than with static maps or tables.
- Watching the circulation of an approaching hurricane or typhoon, or the long-range transport of dust and smoke.
- Education and outreach: the site is in the CLEAN educational collection, and its eleven languages and eight projections suit classroom demos.
- Skimming the forecast shape of a single variable (temperature, precipitation, CAPE, significant wave height) over the coming hours to about fifteen days.
- Sharing "the global wind field at this moment, from this angle" as a plain URL.
Limitations
- Every layer is model output, not measurement; the operator explicitly disclaims accuracy, and GEOS-5 chemistry layers are labeled experimental, for research only. It is no substitute for official weather warnings.
- "Current" data lags by different amounts per layer: at verification the atmosphere layer reflected a model run from about 40 minutes earlier, currents and sea temperature update daily, and chemistry and particulates less often — what you see as "now" is not necessarily the present.
- There is no place search, so finding a specific city means dragging and zooming by hand; there is no API or data download either, and programmatic use requires going to NOAA, Copernicus or the other original sources.
- Layers are color overlays and particle animation only: no point forecast tables or curves, no isolines, no station observations.
- Community translations are uneven: as of 2026-08-31 the Simplified Chinese interface renders the Space mode as "空格" (space bar) and the Bio mode as "简介" (profile).
- The open-source repository has not been pushed since October 2022; building on it means missing features the live site has since gained.
- A dismissible banner promotes the site's own app, and the page loads Google Analytics.
Similar sites
- Windy (also covered in this column): compares multiple forecast models, adds radar and satellite observations and point meteograms, and runs on a commercial model with a Premium tier and a developer API. earth is lighter — no ads, no accounts — and puts the emphasis on the intuitive global flow field.
- Ventusky: a Czech visualization in the same family, richer in conventional weather layers and closer in feel to classic weather services.
- NASA Worldview: daily satellite imagery rather than forecast output — a useful counterpart for switching from the "forecast" to the "observed" view.
References
- earth :: a global map of wind, weather, and ocean conditions (home) (checked 2026-08-31)
- about earth (data sources, update cadence, disclaimer, keyboard shortcuts) (checked 2026-08-31)
- Nullschool Technologies Inc. (company background and profile) (checked 2026-08-31)
- cambecc/earth on GitHub (MIT-licensed free version) (checked 2026-08-31)
- Simplified Chinese and Traditional Chinese interfaces (checked 2026-08-31)
- Global Wind Map — Slate, December 2013 (checked 2026-08-31)
- Wind wonderfully visualized: First Tokyo, now the world — The Bridge (checked 2026-08-31)