Connected Papers is a visual literature-discovery tool for researchers and applied scientists: give it one paper, and it builds a graph of several dozen similar papers around that "seed," helping you see the shape of a research field at a glance and check that you haven't missed important work. Unlike a citation tree, the graph arranges papers by similarity—two papers can sit close together even if neither cites the other, as long as their citations and references overlap heavily. The underlying data comes from Semantic Scholar's open paper corpus, which covers hundreds of millions of papers across many scientific fields.
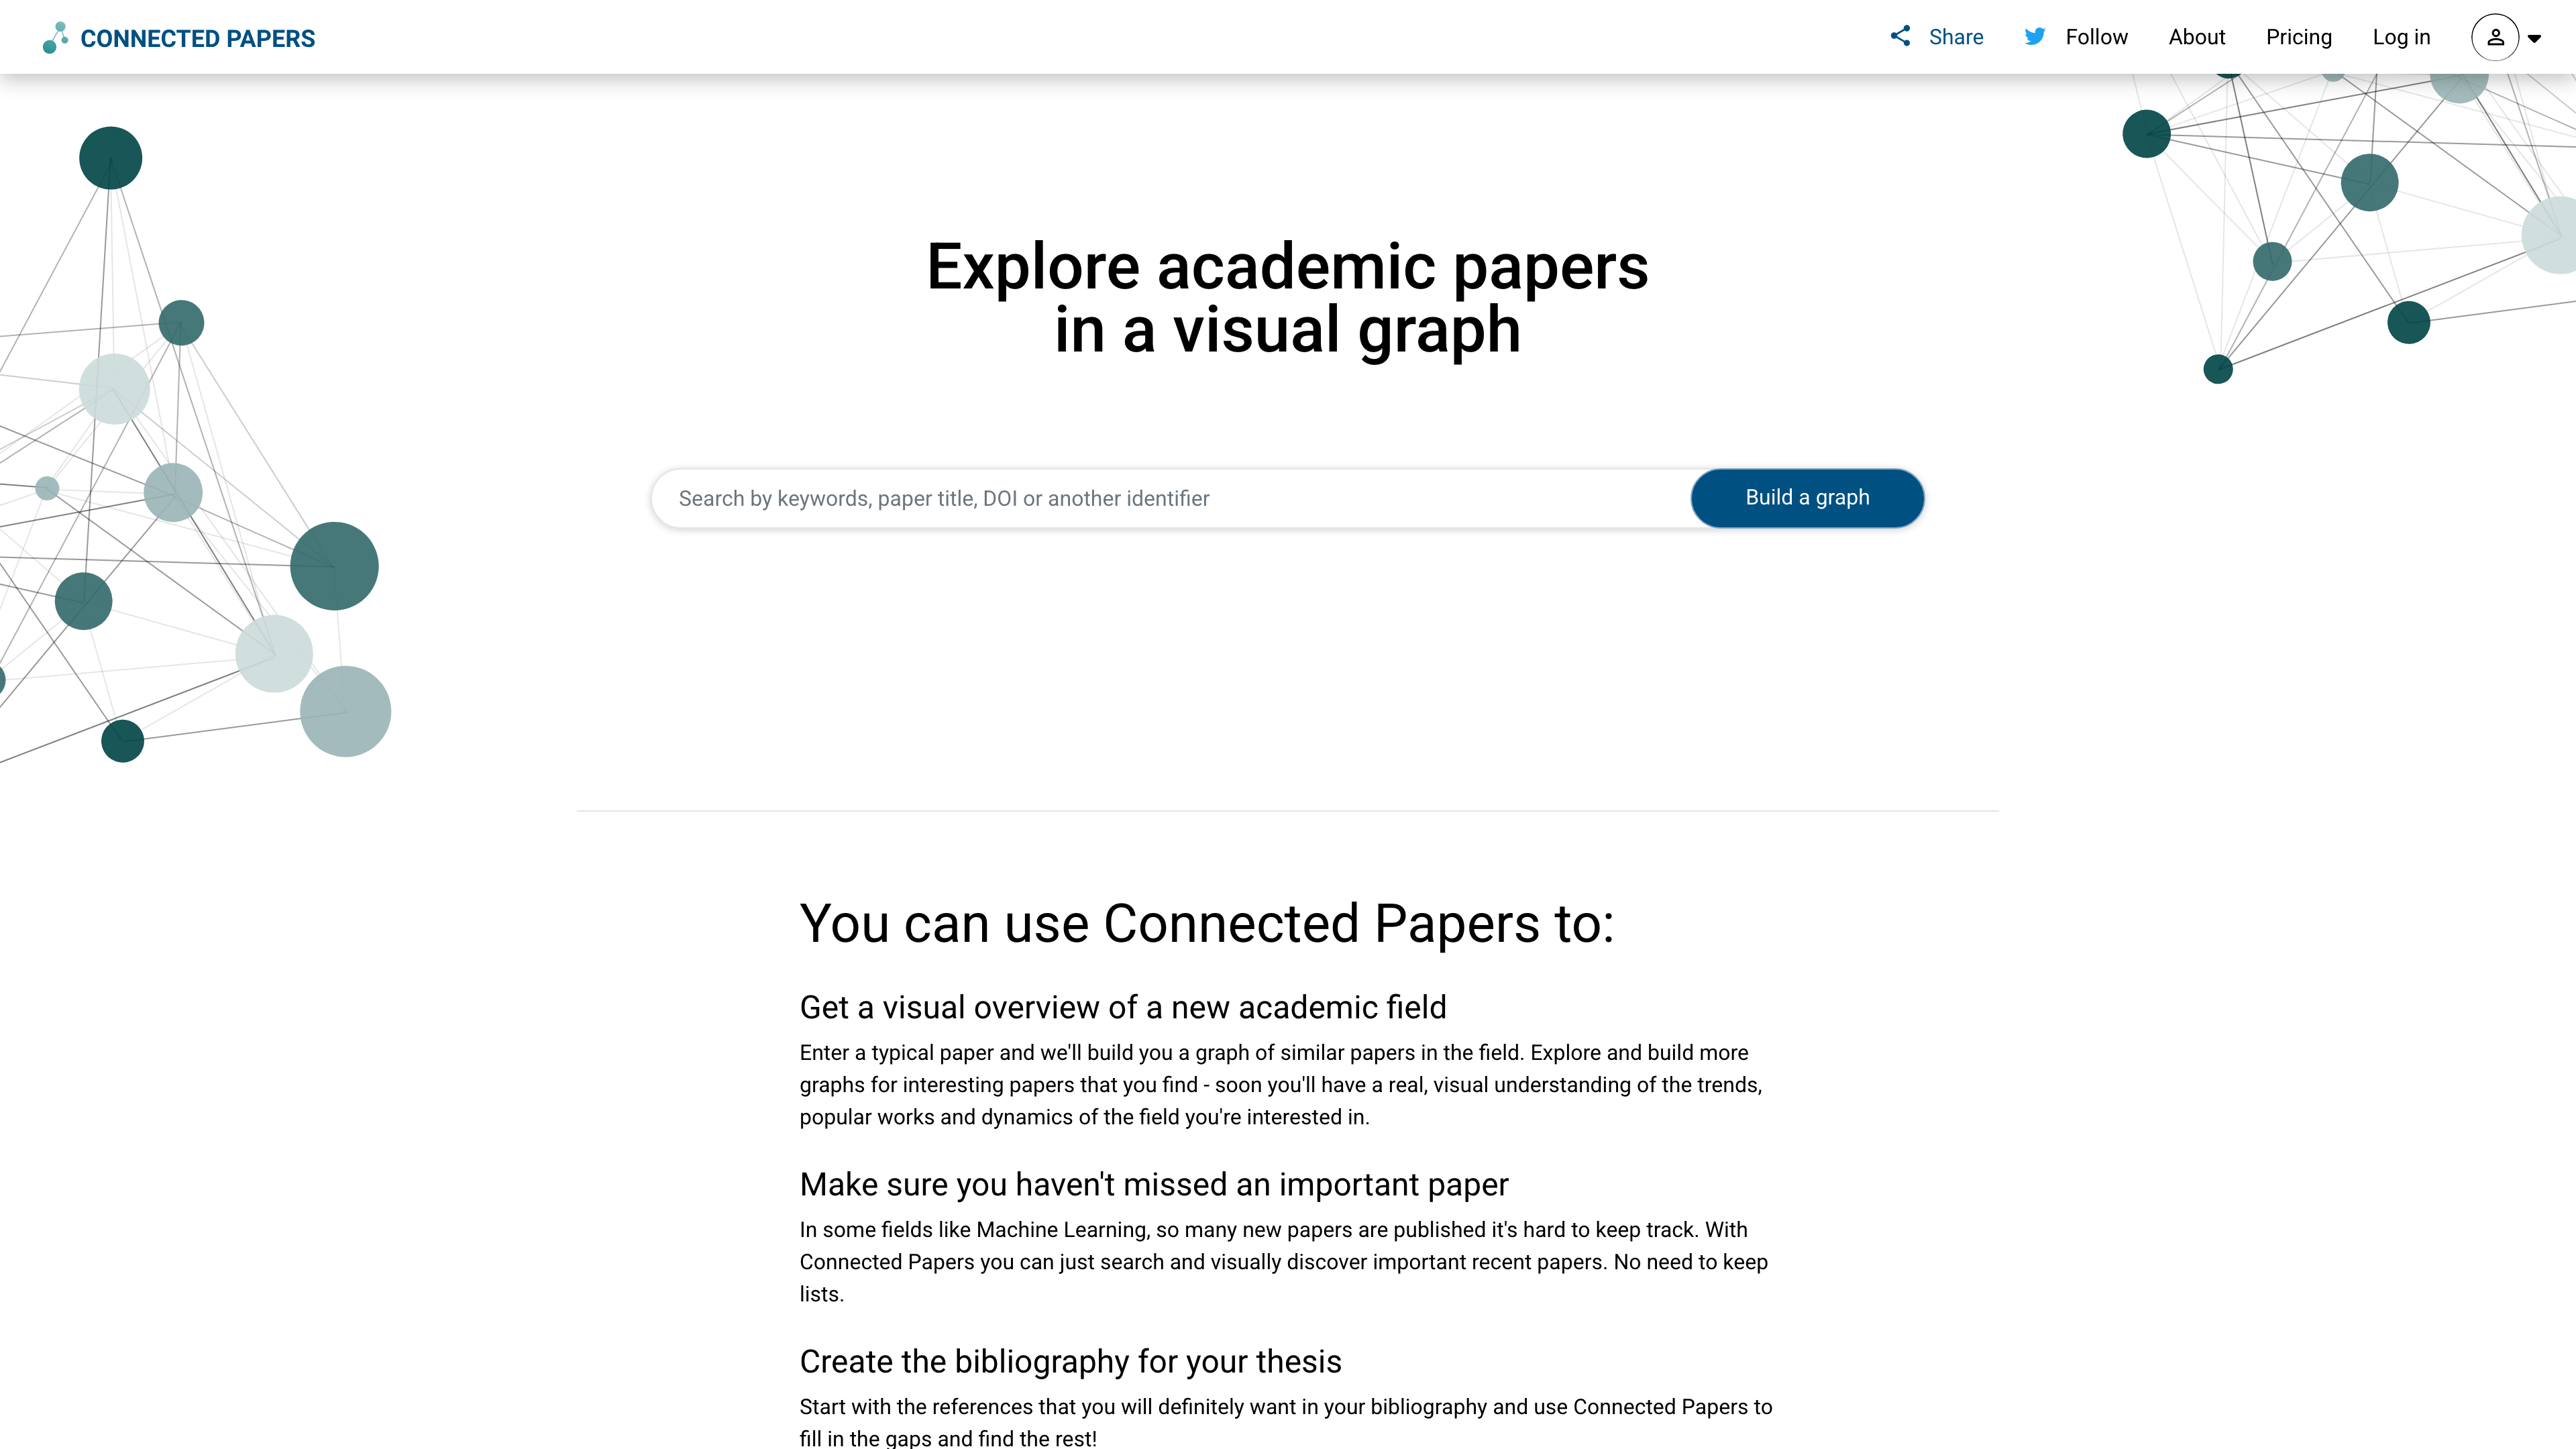
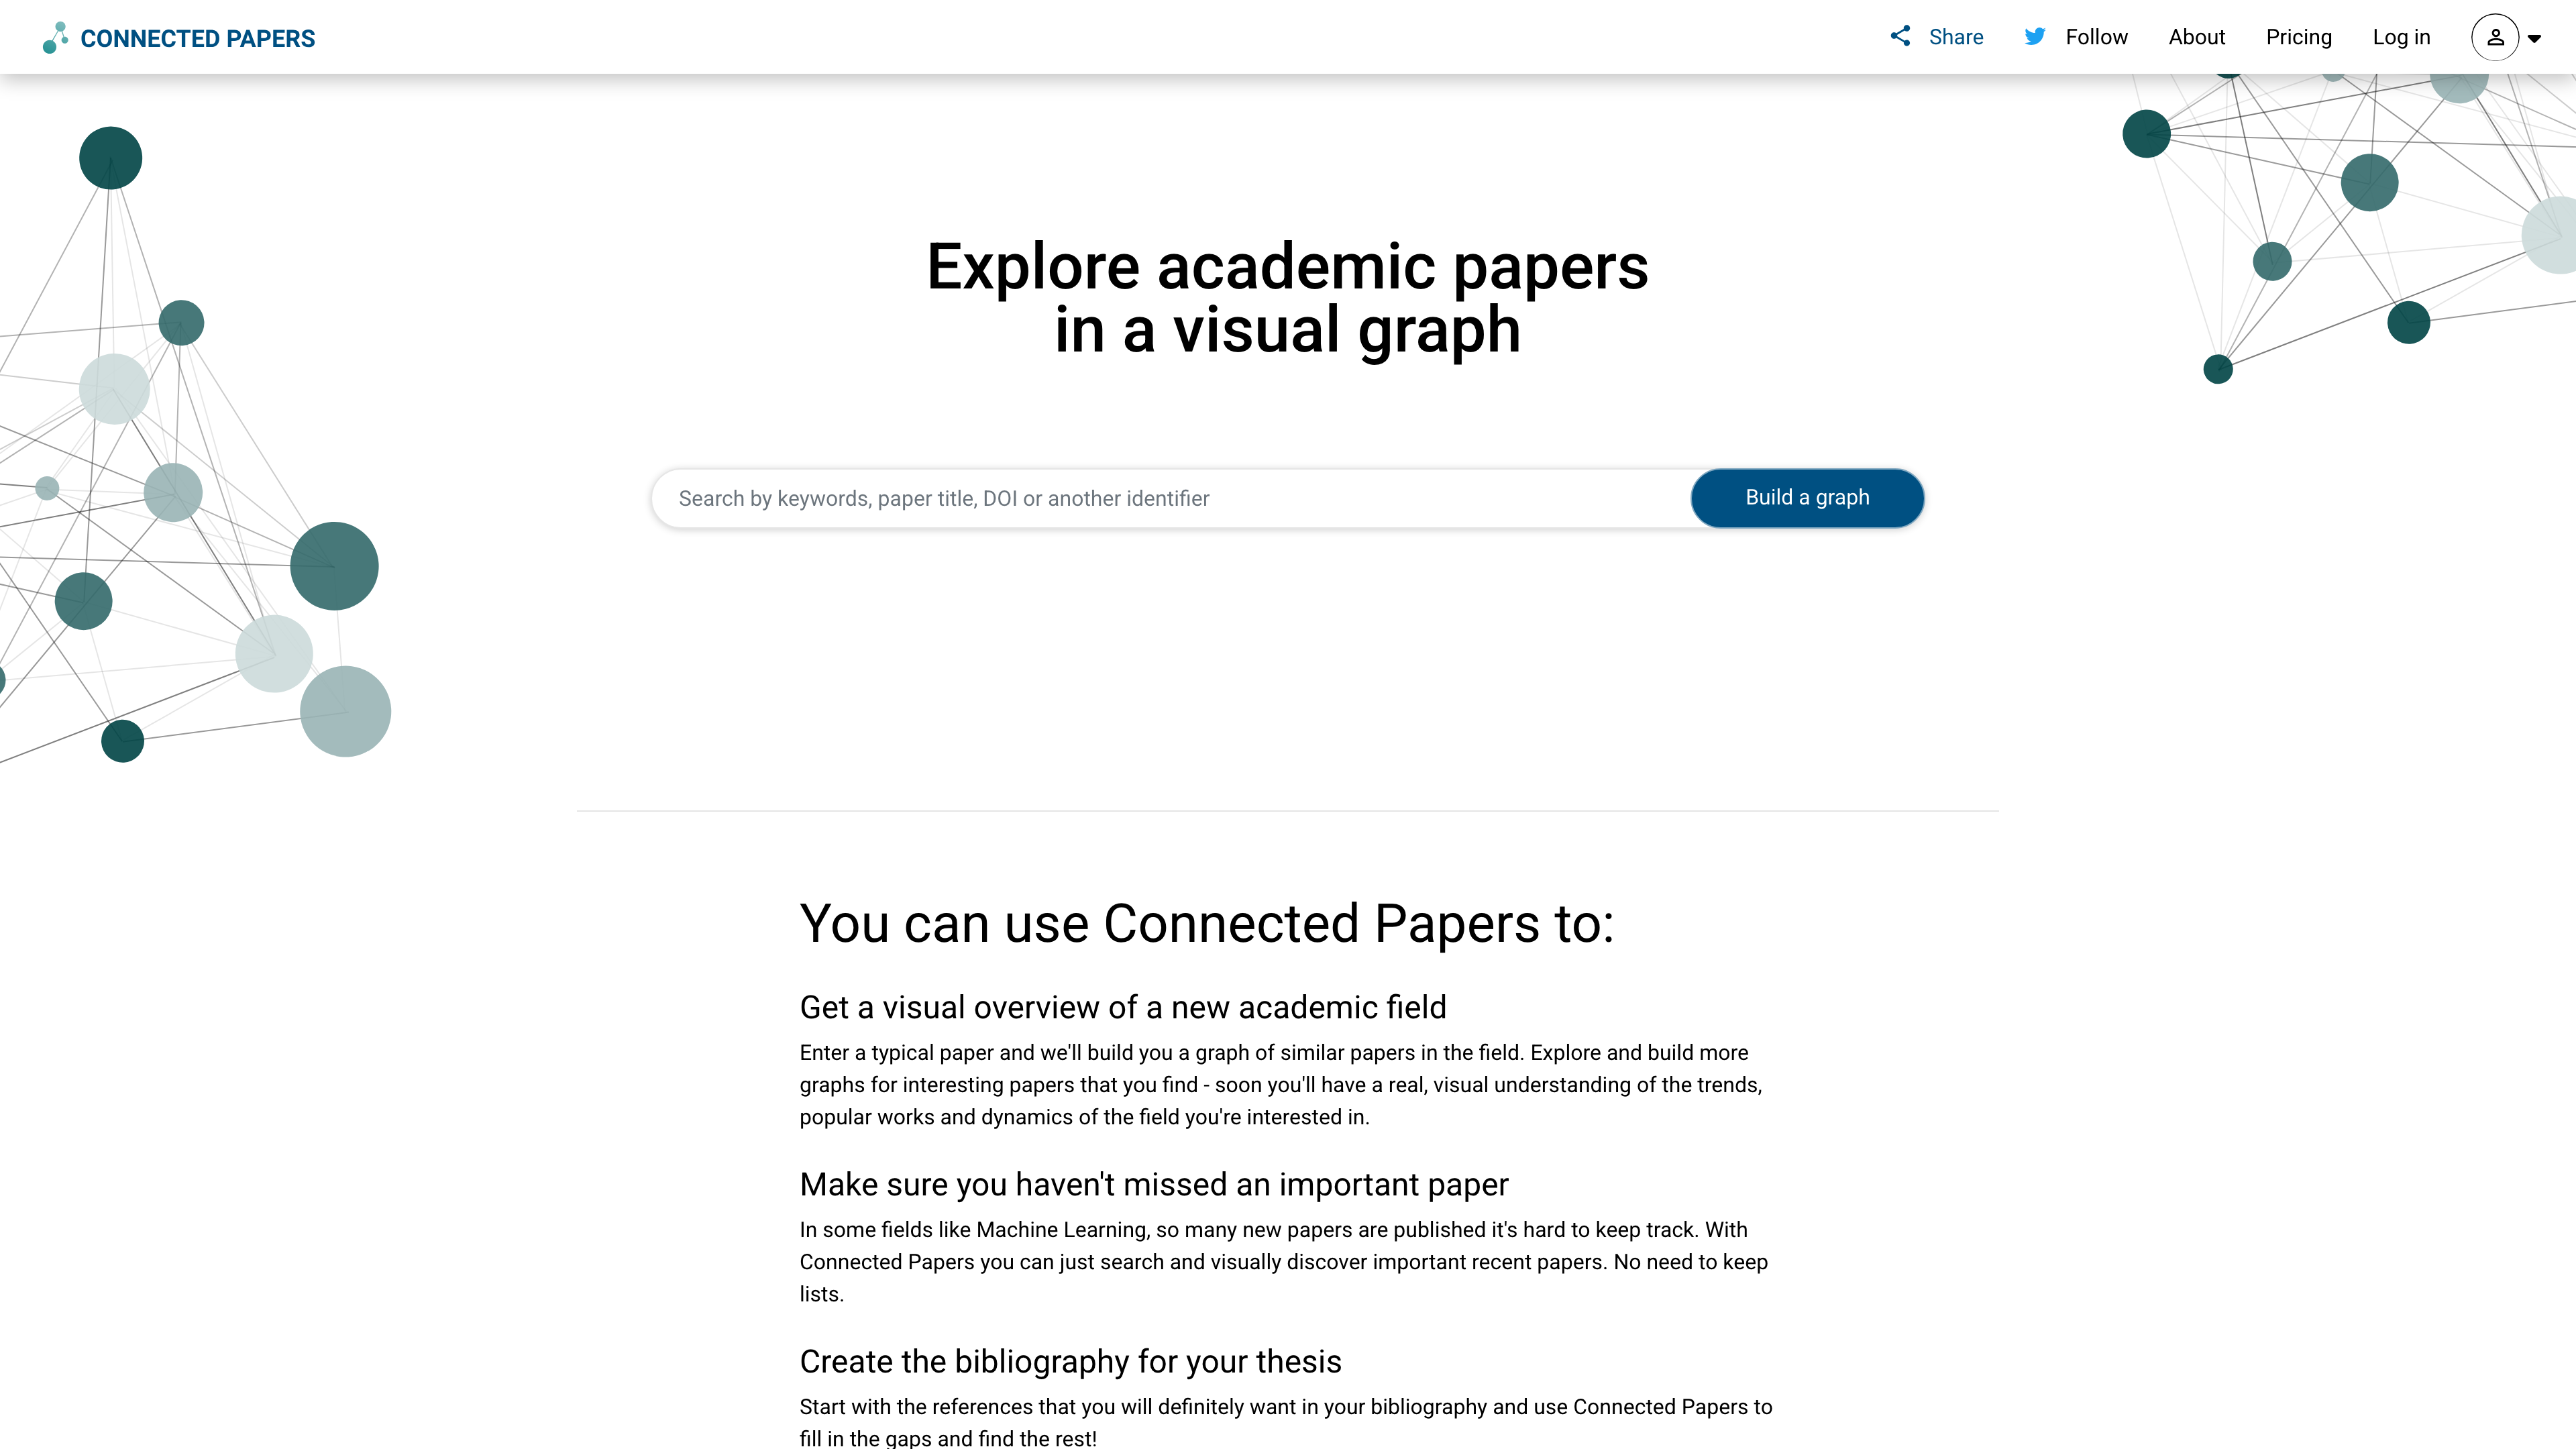
The screenshot above shows the home page: the search box accepts keywords, a paper title, a DOI, or another identifier, and "Build a graph" starts the analysis. Below the fold, the site lists four typical uses—getting a visual overview of a new field, making sure no important paper is missed, building a thesis bibliography, and discovering prior and derivative works. The interface is available in English only.
At a glance
- URL: https://www.connectedpapers.com/
- Type: academic literature similarity graphs / literature-discovery tool
- Cost: free tier with 5 graphs per month; unlimited subscriptions from 20/month (Business, annual billing), as of 2026-09-02
- Account: free quota and subscriptions are account-based; searching papers and opening shared public graph links worked without logging in when checked on 2026-09-02
- Interface language: English only
- Launched: public release in June 2020
- Operated by: an independent four-person team (Israel)
Background
Connected Papers began as a weekend side project among friends. In their launch post, the team describes years of frustration with academic literature search, about a year of weekend prototyping, and a long beta before the public release on June 8, 2020. The pricing page FAQ describes the team as "a group of 4 friends" and says the service has grown to hundreds of thousands of users; according to Ness Labs, the founders include Alex Tarnavsky, Eddie Smolyansky, and Itay Knaan Harpaz from Israel. The terms of service (last updated 2023-02-21) are governed by the laws of the State of Israel.
In the launch-thread comments, the team states that the code is proprietary rather than open source. Funding initially came out of pocket plus donations; the service later moved to the current "free quota + subscription" model.
How the similarity graph works
According to the official About page, each graph is built by analyzing on the order of 50,000 papers and selecting the few dozen with the strongest connections to the origin paper. Similarity is based on co-citation and bibliographic coupling: the more two papers' citations and references overlap, the more likely they treat related subject matter. A force-directed layout then clusters similar papers together and pushes dissimilar ones apart; selecting a node highlights its shortest path to the origin paper in similarity space.
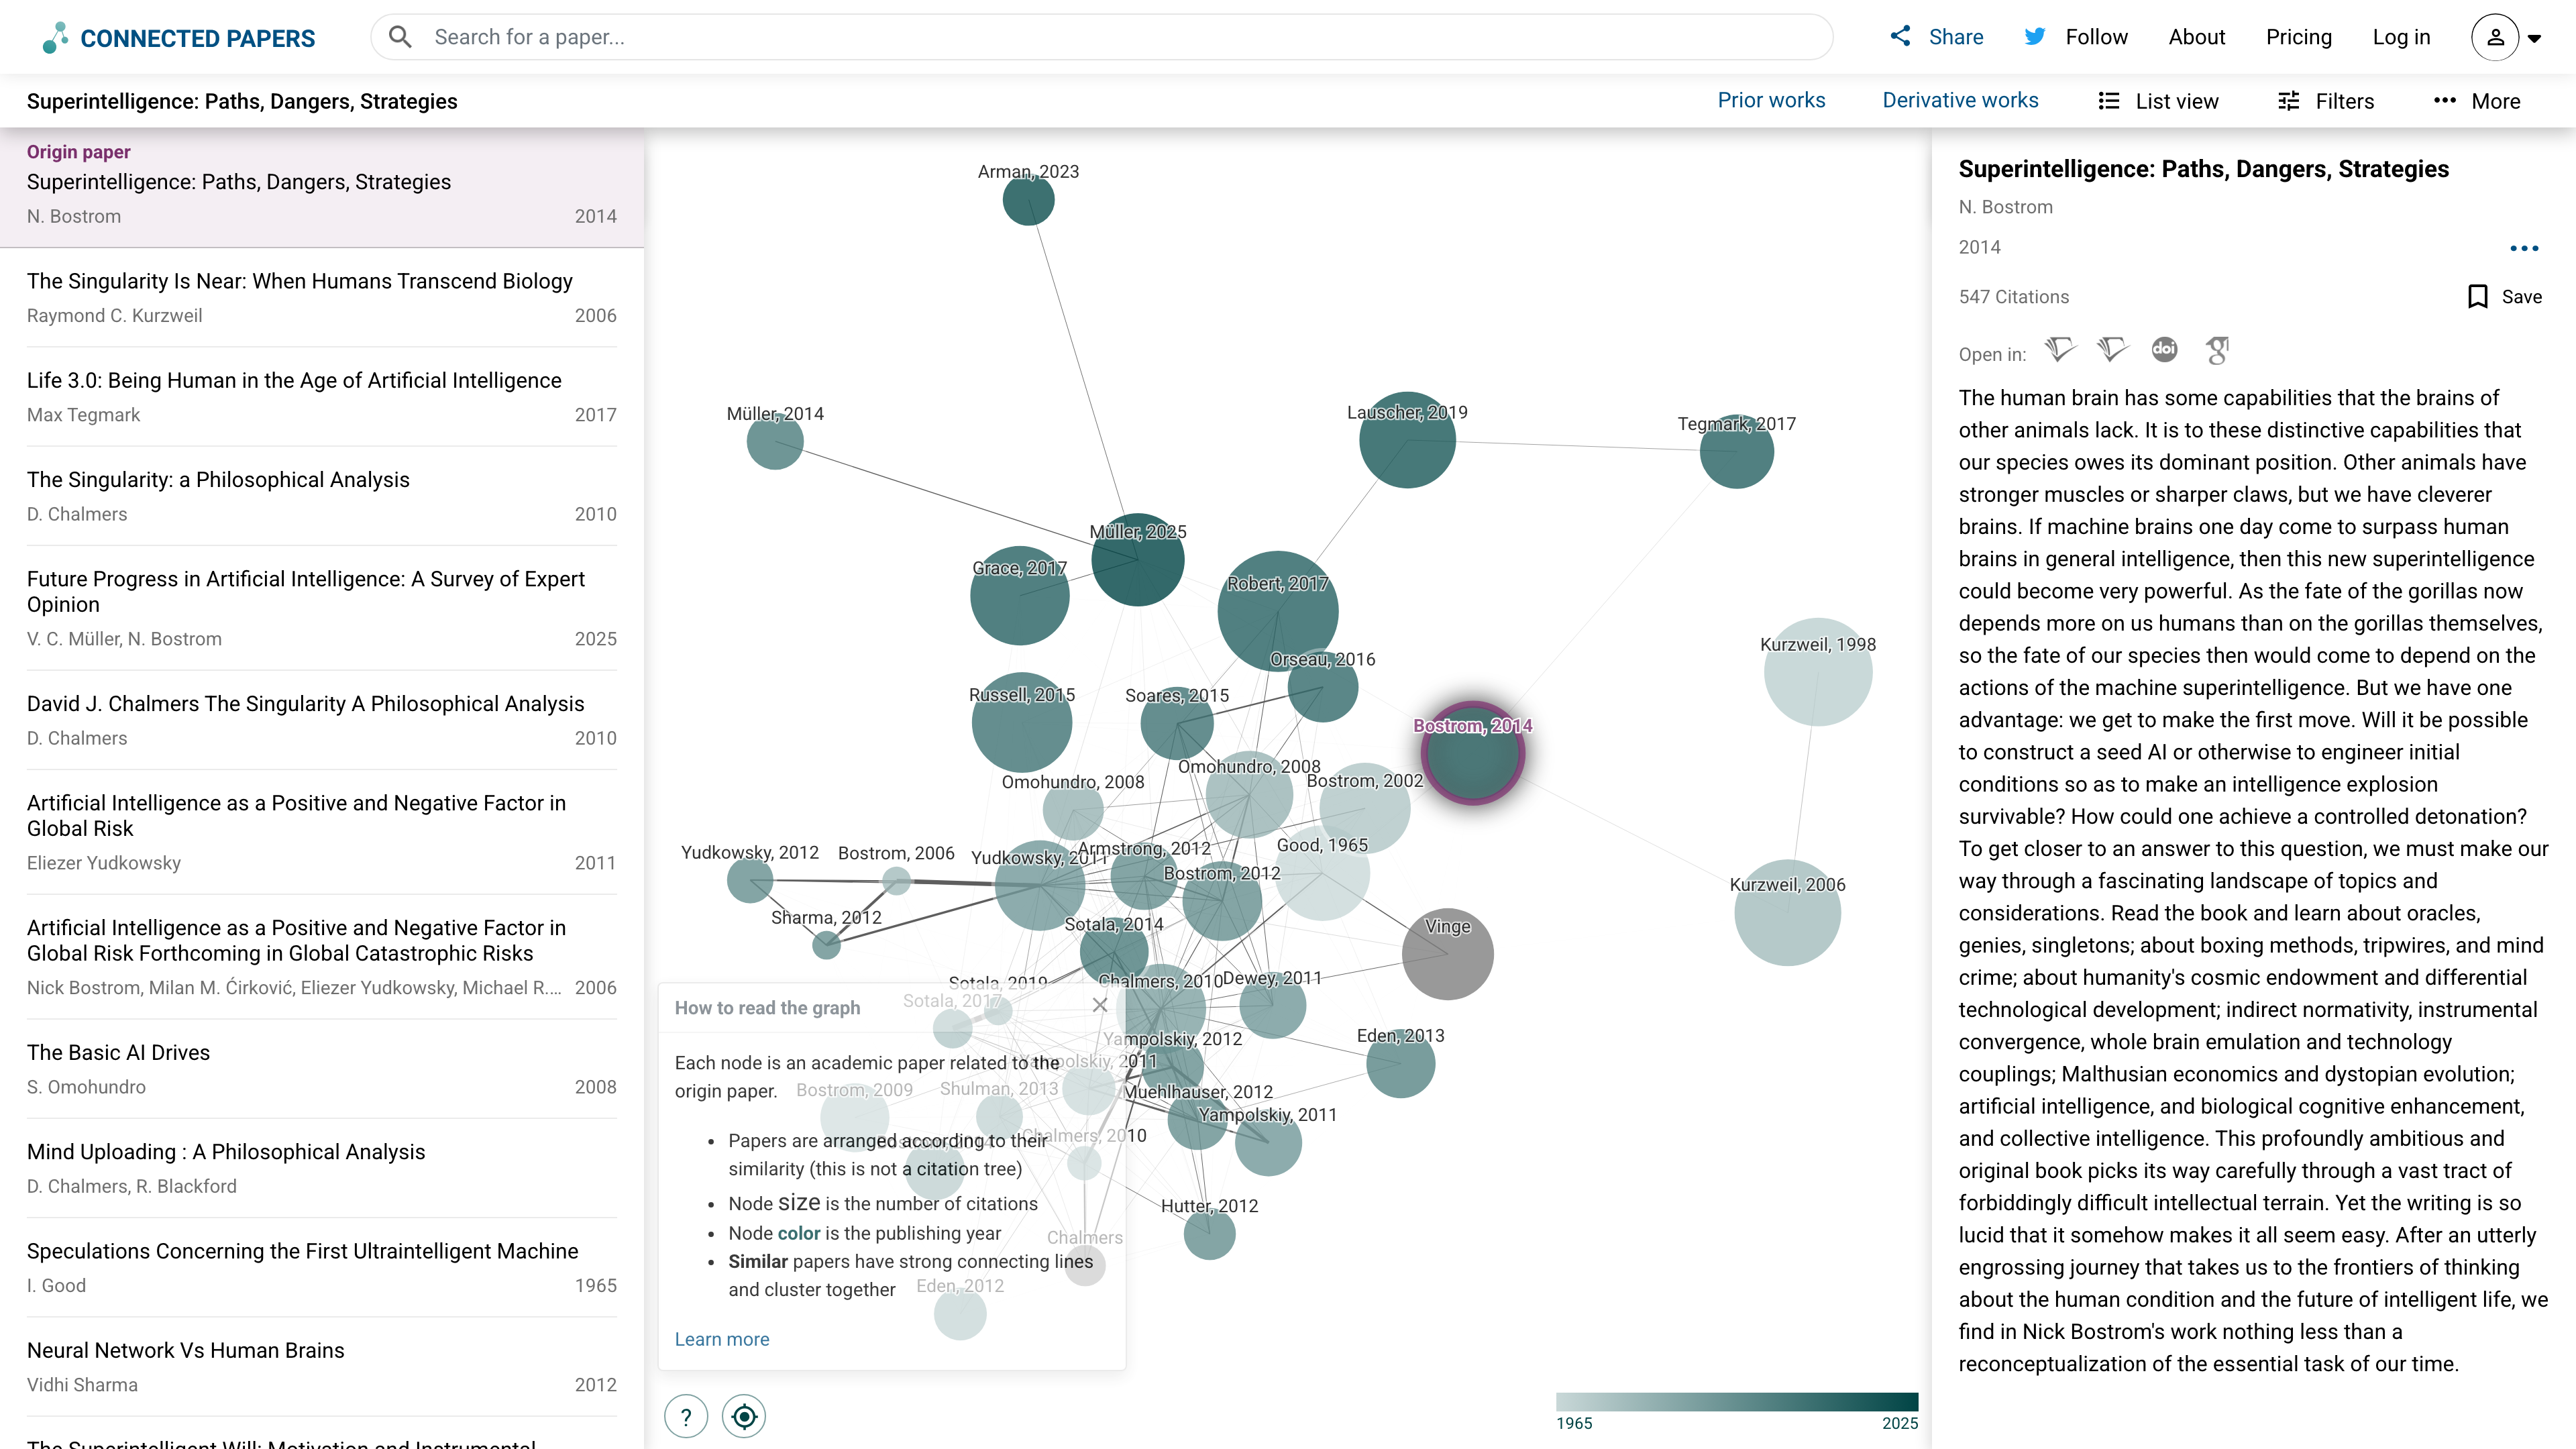
The screenshot above shows a public graph seeded from Nick Bostrom's Superintelligence: Paths, Dangers, Strategies (viewable without logging in). The left panel lists the papers in the graph; the right panel shows the selected seed paper's details (citation count, abstract, outbound links). The legend in the lower left explains how to read the graph: node size is the number of citations, node color is the publishing year (darker means more recent), and similar papers share stronger connecting lines and cluster together—with an explicit reminder that "this is not a citation tree." Tabs at the top switch to Prior works, Derivative works, List view, and filters.
Key features
- Similarity graphs: a visual overview of the few dozen papers most similar to a seed paper; multi-origin graphs can center on several papers at once.
- Prior works: the ancestral papers most commonly cited by the graph's papers—useful for finding the seminal works of a field.
- Derivative works: newer papers that commonly cite the graph's papers, often recent literature reviews, meta-analyses, or state-of-the-art results.
- List view: expands the graph into a sortable, filterable paper list with more metadata.
- Saved papers and graph history: signed-in users can save papers and revisit past graphs; included in every plan, including the free tier.
Pricing and accounts
As of 2026-09-02, the individual plans on the official pricing page are as follows (seat-based Groups plans for teams and institutions are also offered):
| Plan | Annual billing | Quarterly billing | Graph quota | Intended for |
|---|---|---|---|---|
| Free | $0 | — | 5 graphs per month, all features included | Everyone |
| Academic | 72 billed annually) | 30 billed quarterly) | Unlimited | Academics, non-profits, and personal use |
| Business | 240 billed annually) | 90 billed quarterly) | Unlimited | Business and industry |
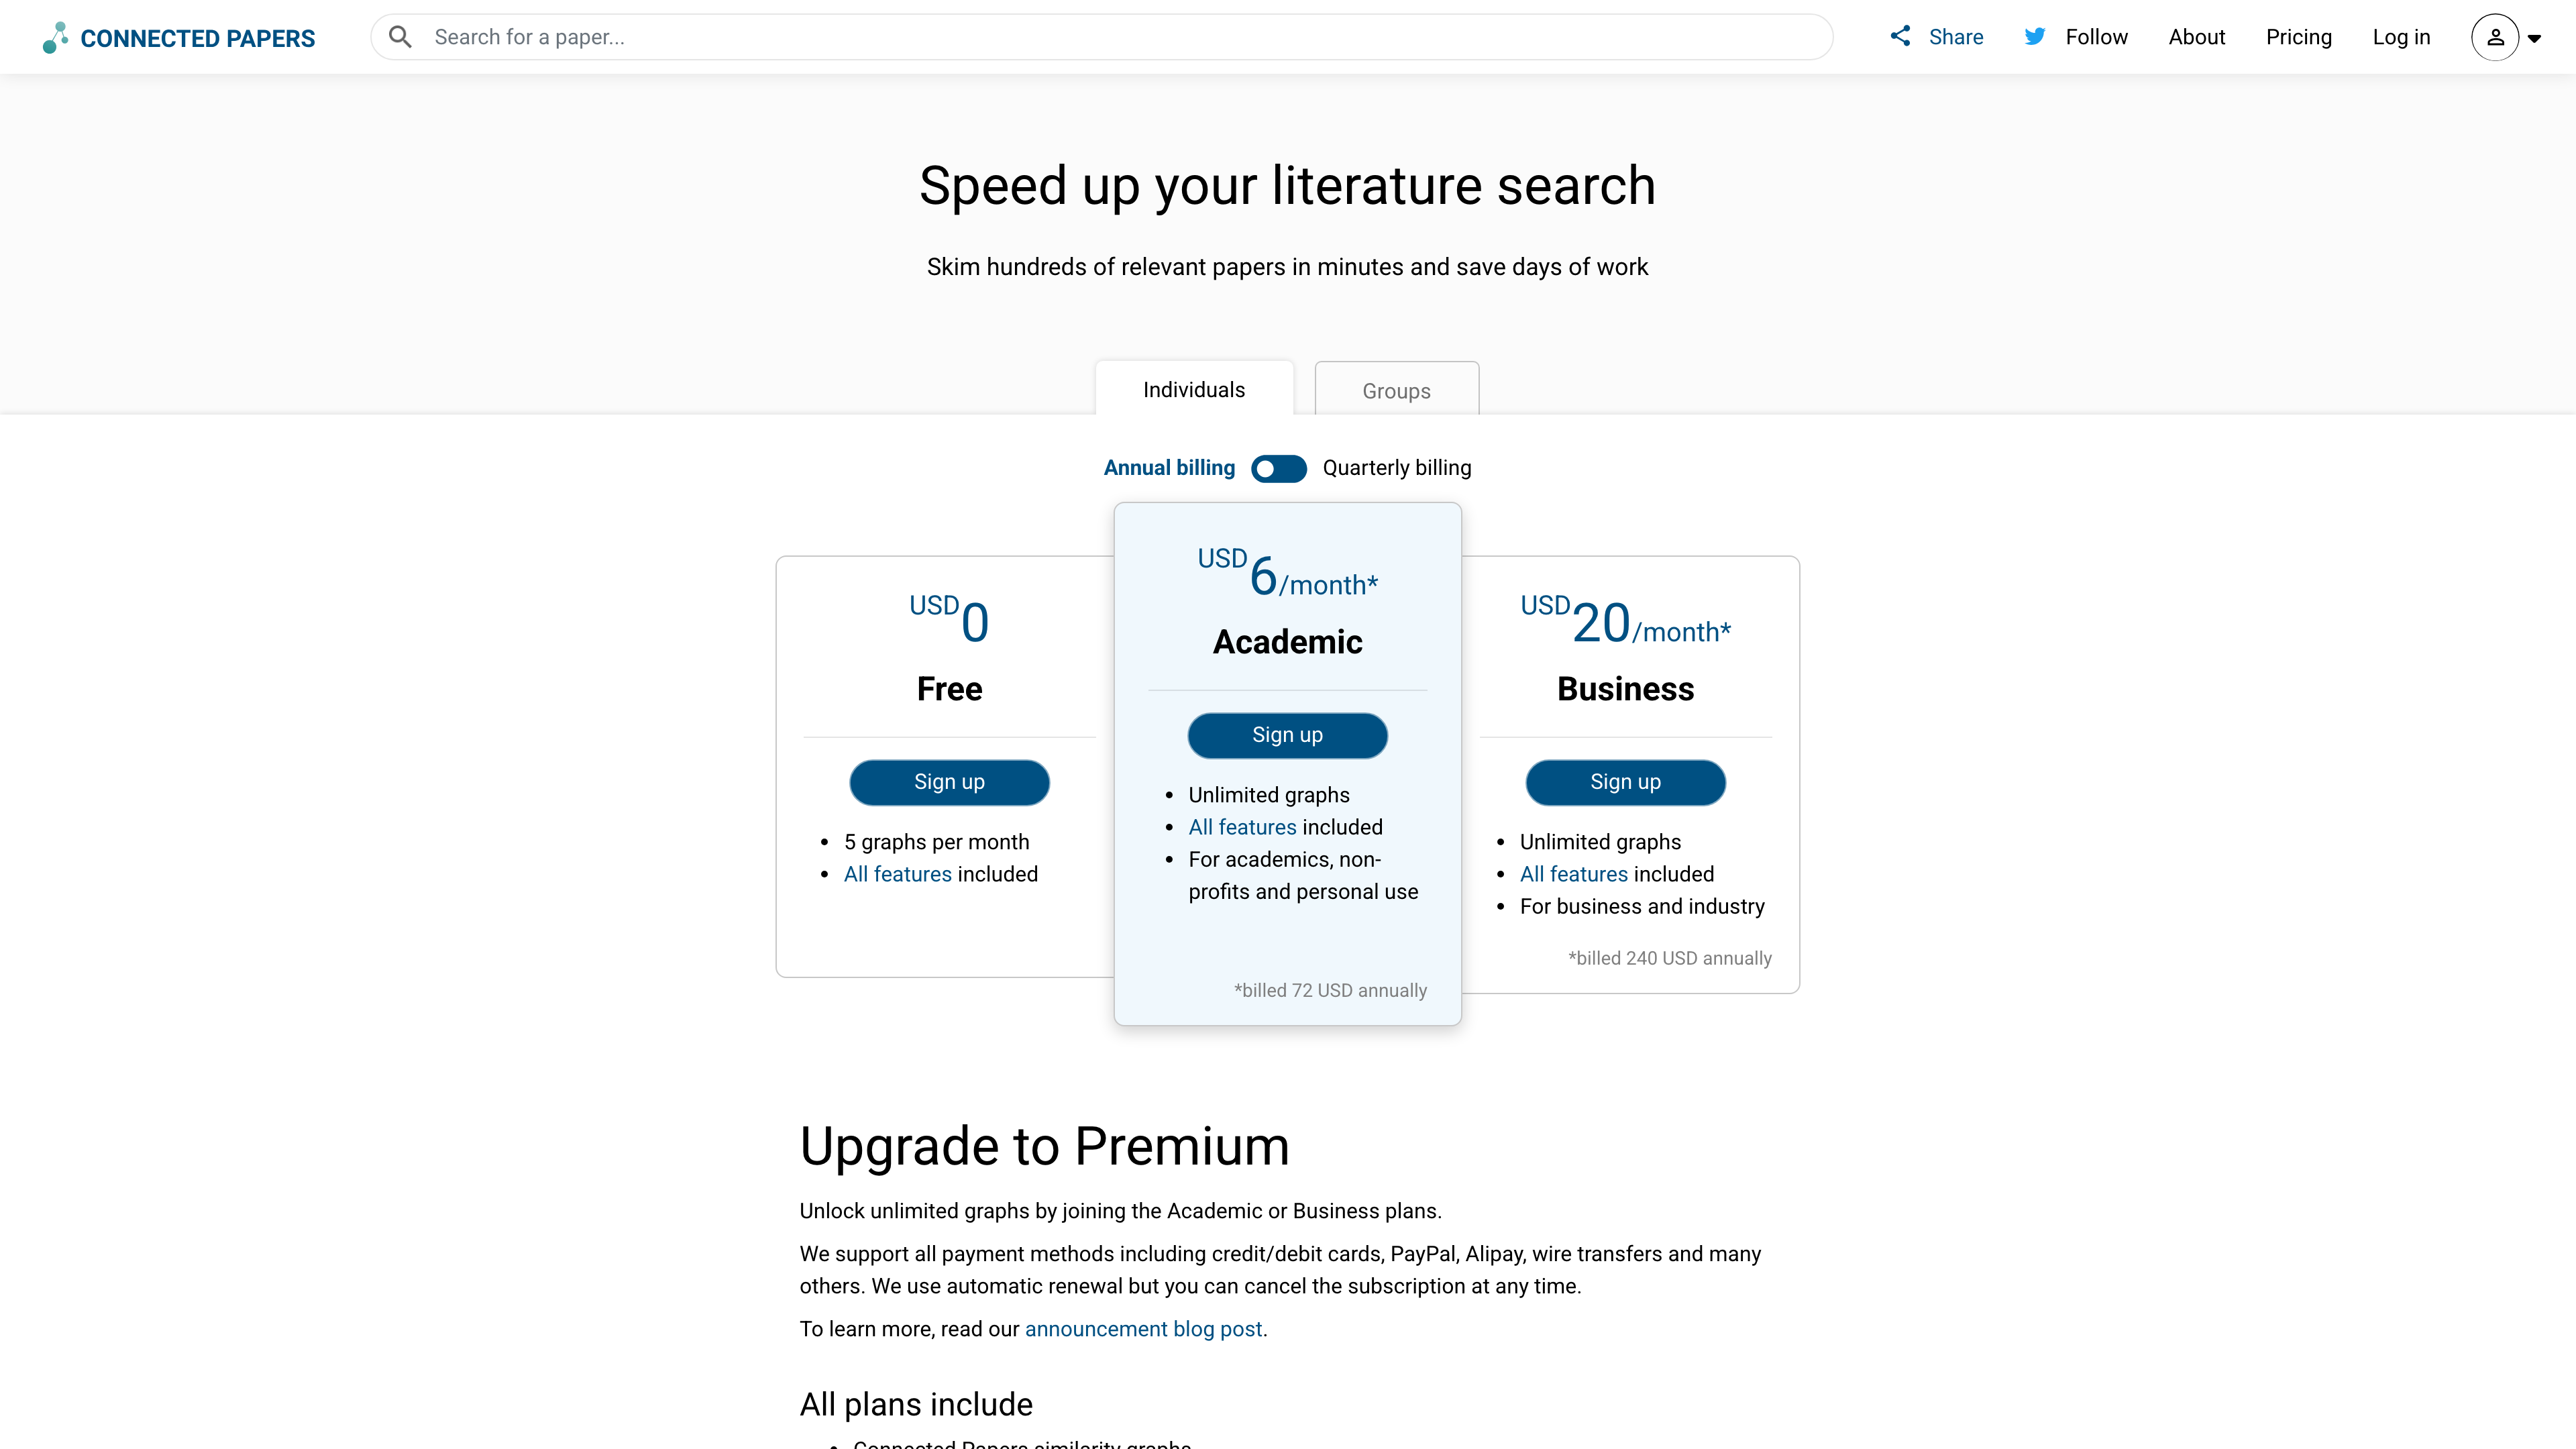
The screenshot shows the pricing page: all three tiers include the full feature set (similarity graphs, prior and derivative works, multi-origin graphs, saved papers, and graph history), differing only in graph quota and permitted use. Academic and Business are functionally identical, but the terms of service restrict Academic subscriptions to generally recognized academic and educational purposes, excluding commercial use.
Payments are processed by PayPro Global and support credit/debit cards, PayPal, Alipay, wire transfers, and more. Subscriptions renew automatically and can be cancelled at any time; the initial term is one year for annual plans and three months for quarterly plans, and refunds are only made for double coverage (buying an individual plan and then receiving group or institutional access). Researchers who genuinely cannot afford a subscription can apply to the scholarship program (scholarships@connectedpapers.com) for a discounted or free Premium plan.
Signing up requires an email address and password. The terms note that the service collects usage data such as login dates, pageviews, opened links, search queries, and saved papers, and uses Google Analytics.
API access
Connected Papers offers an official API, currently in early access—request a token by emailing hello@connectedpapers.com. The team maintains an official Python client, connectedpapers-py, and a JavaScript client, connectedpapers-js, supporting graph retrieval, remaining-quota checks, and listing papers that can be re-accessed for free. Papers are identified by their Semantic Scholar ShaID. A fresh graph build usually takes around 10 seconds and up to about a minute; built graphs are cached for roughly a month, and re-fetching within 31 days does not count against the quota. The default rate limit is 5 builds per minute, and since the November 2025 API update, throttled requests return an OVERLOADED status. The web frontend is not open source, so API integration is the only automation path.
Data and licensing
The graphs are built on the Semantic Scholar Open Research Corpus (S2 ORC), released under the ODC-BY license and described as containing hundreds of millions of published papers across many scientific fields. Coverage and data quality therefore depend on Semantic Scholar's indexing and parsing; the team acknowledges in the launch thread that errors in the dataset show up in the graphs, and that a license change at the corpus level would affect the service. Copyright in the papers themselves remains with their publishers—Connected Papers is a discovery and visualization layer, and clicking a node leads out to the publisher or preprint page.
Where it fits best
- Getting a fast, visual grounding in an unfamiliar field from one or two representative papers
- Filling gaps in a thesis or review bibliography starting from references you already have
- Keeping up with important new work in fast-moving fields such as machine learning
- Tracing seminal papers via Prior works and locating recent surveys via Derivative works
Limitations
- Low free quota: only 5 new graphs per month, so heavy use effectively requires a subscription; plans start at annual or quarterly terms, and refunds are limited to double coverage.
- Single external data source: coverage and accuracy are bounded by the Semantic Scholar corpus; the team notes that dataset errors propagate into graphs and that a corpus license change could affect the service.
- Not a citation tree: the graph encodes similarity, not citation direction—tracing who-cited-whom still calls for tools like Google Scholar or Semantic Scholar.
- English-only interface: no other UI languages are offered.
- Proprietary software: the code is not open source and cannot be self-hosted.
Alternatives
- ResearchRabbit: a free literature-discovery tool that recommends related work around collections of papers, with Zotero sync.
- Litmaps: a citation-based literature-mapping tool with visual exploration and a subscription model.
- Semantic Scholar: the underlying data source itself, offering free paper search and an open API.
References
- Connected Papers home page (positioning and typical uses, checked 2026-09-02)
- About (~50,000 papers analyzed per graph, co-citation and bibliographic coupling, force-directed layout; origin story)
- Pricing (free quota, plan prices, Groups plans, scholarship program, FAQ; checked 2026-09-02)
- Terms of service (updated 2023-02-21; S2 ORC under ODC-BY, subscription and refund terms, data collection, Israeli jurisdiction)
- LessWrong launch post (public release on 2020-06-08, how to read the graph, proprietary code, dataset dependence)
- connectedpapers-py and connectedpapers-js (official API clients, token request, caching, rate limits)
- Ness Labs: Connected Papers (founder names and Israeli background)